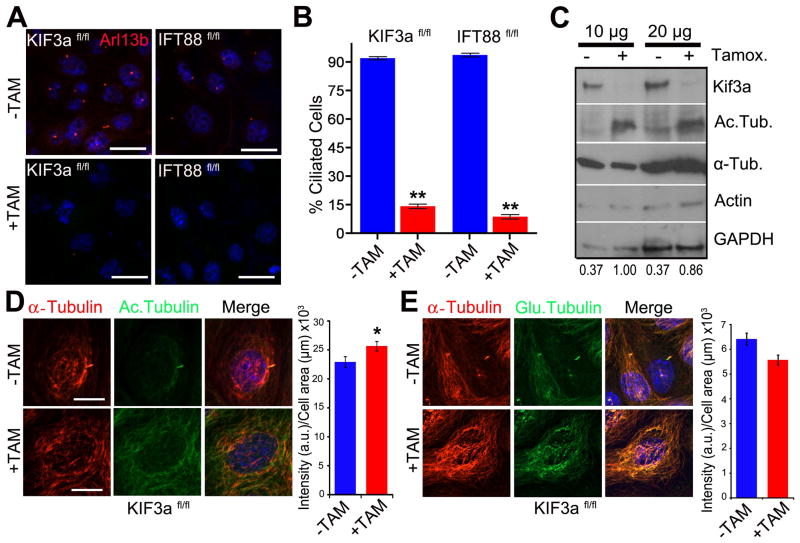
Figure 1. Loss of primary cilia is associated with increasedα-tubulin acetylation.
(A) Immunofluorescence staining for the cilia marker Arl13b (red) in wildtype noninduced (−TAM) and tamoxifen-induced (+TAM) Kif3aflox/flox; CAAG-CreER (Kif3afl/fl) and IFT88flox/flox; CAAG-CreER (IFT88fl/fl) kidney epithelial cells. Scale bars 21 μm. (B) Quantification of cilia in control (−Tam) and mutant (+Tam) Kif3afl/fl and IFT88fl/fl cells. Bars show mean percent ciliated cells ± SEM, asterisks indicate a significant change of measurements compared with the control group (Student’s t-test; **P < 0.01). (C) Western blot analysis for α-tubulin acetylation, total α-tubulin, and actin using 10 μg and 20 μg of protein Kif3a mutant and control cells. Loading control is GAPDH. Numerical values at bottom are the densitometric ratio of acetylated α-tubulin to GAPDH normalized to the most intense band. (D, left panel) Immunofluorescence for α-tubulin (red) and acetylated-α-tubulin (green) in Kif3afl/fl conditional cells. Scale bar: 14 μm. (D, right panel) A graph measuring the fluorescence intensity of acetylated α-tubulin staining comparing control (−TAM) and Kif3a mutant (+TAM) cells. Bars show mean acetylated tubulin intensity per μm2 of each cell ± SEM, asterisks indicate a significant change of measurements compared with the control group (Student’s t-test; *P < 0.05). (E, left panel) Immunofluorescence forα-tubulin (α-tubulin, red) and poly-glutamylated tubulin (Glu. Tubulin, green) in Kif3afl/fl conditional mutant cells treated or nontreated with tamoxifen. Scale bar: 20μm. All nuclei stained with Hoechst in blue. (E, right panel) A graph measuring the fluorescence intensity of glutamylated α-tubulin staining comparing wildtype (−TAM) and cilia mutant (+TAM) cells. Bars show mean glutamylated tubulin intensity per μm2 of each cell ± SEM (n=102,68; Student’s t-test; P = 0.09)

