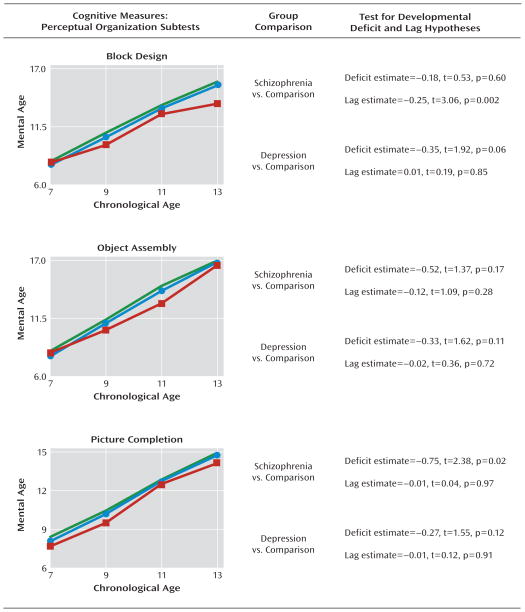
FIGURE 4. Mental Age Perceptual Organization Scores by Assessment Age Among Children Who Later Developed Adult Schizophrenia or Recurrent Depression and Healthy Comparison Subjectsa.
a Data illustrate mean scores (green line represents healthy comparison subjects [N=556]; red line represents children who grew up to meet diagnostic criteria for schizophrenia [N=35]; blue line represents children who grew up to meet diagnostic criteria for recurrent depression [N=145]). The results show nonstandardized estimates of the differences between groups in the intercept and linear slope along with corresponding t tests and significance values from the growth-curve models.

