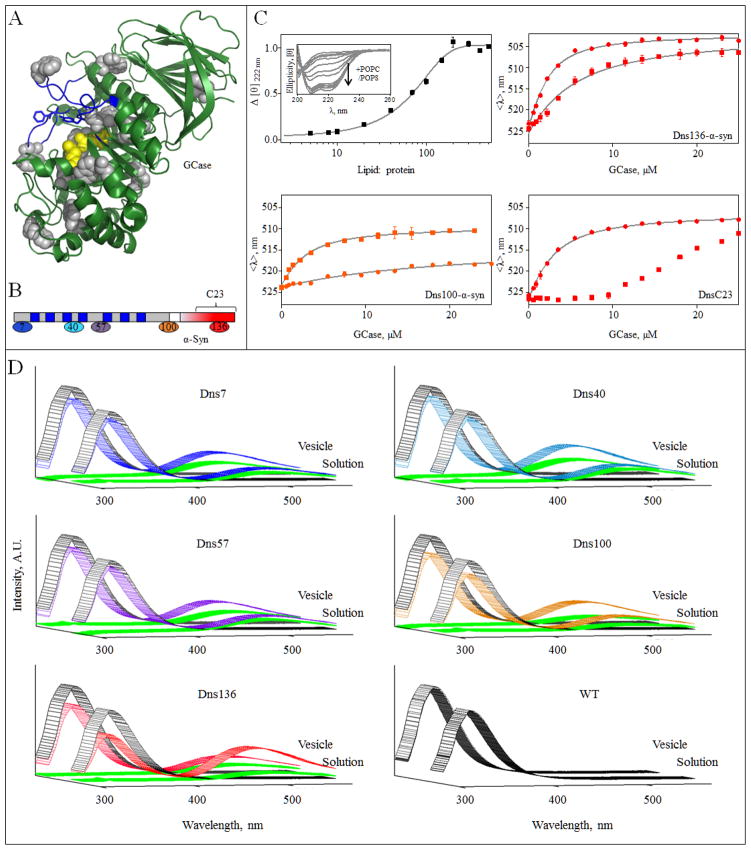
Fig 1.
α-Syn GCase interaction in the presence of vesicles. A, GCase crystal structure (PDB code 2NSX [60]). The intrinsic 12 Trp residues are shown in gray and were used as Förster energy transfer donors. Active site residues (E235 and E340) are in yellow. Loops 1–3, regions proposed to be important for substrate recognition and activity [60, 61], are highlighted in blue. For clarity, residues 286–290 were omitted. B, Schematic representation of α-syn primary sequence. The seven amphipathic imperfect repeat regions (blue) in the membrane binding domain (gray) and the acidic C-terminal region (red) are denoted. The location of Dns-labeling sites, residues 7, 40 and 57 (membrane binding domain) and residues 100 and 136 (C-terminal domain) are indicated. The same color representation is used in panels C and D. Location of peptide C23 (residue 118–140) is also indicated. C, Normalized change in mean residue ellipticity Δ[θ]) as a function of lipid-to-protein ratio (50 mM MES, 25 mM NaCl, pH 5.5, [WT α-syn] = 5 μM). Error bars indicate standard deviations from two independent measurements (top left). POPC/POPS vesicles induced secondary structure in α-syn (top left, inset). GCase titration curves for Dns136-α-syn (top right), Dns100-α-syn (bottom left), and Dns136-C23 peptide (bottom right). The titration curves were obtained from mean spectral wavelength (<λ>) in 50 mM MES, 25 mM NaCl at pH 5.5 in the absence (●) or presence of 0.9 mM POPC/POPS vesicles (■). Error bars indicate standard deviations from two replicate samples. Fits are shown as lines. D, Förster energy transfer from GCase to DnsX-α-syn. Measurements were performed in the presence of 2 μM GCase (Trp donor, excited at 295 nm) and 5 μM DnsX-α-syn (Dns acceptor), either in the absence or presence of vesicles at pH 5.5 (colored according to panel B). Fluorescence spectra of GCase and DnsX-α-syn alone are shown in gray and green, respectively. WT syn was used as a negative control.

