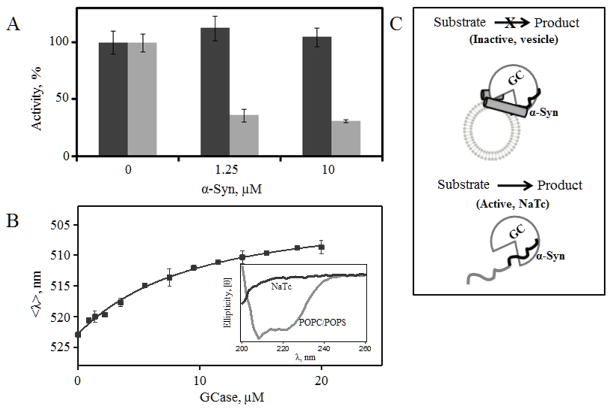
Fig 3.
Effect of α-syn secondary structure on GCase activity. A, Comparison of GCase activity in the presence of NaTc (black) and POPC/POPS vesicles (gray) upon the addition of α-syn. B, GCase titration curve obtained from mean spectral wavelength (<λ>) of Dns136-α-Syn at pH 5.5 in the presence of 3 mM NaTc. Fit is shown as a line. Inset, Circular dichroism spectra of α-syn in the presence of NaTc (black) and POPC/POPS vesicles (gray). C, A schematic diagram depicting that while α-syn interacts with GCase in the presence of both NaTc and POPC/POPS vesicles, only the α-helical vesicle-bound α-syn inhibits enzyme activity.

