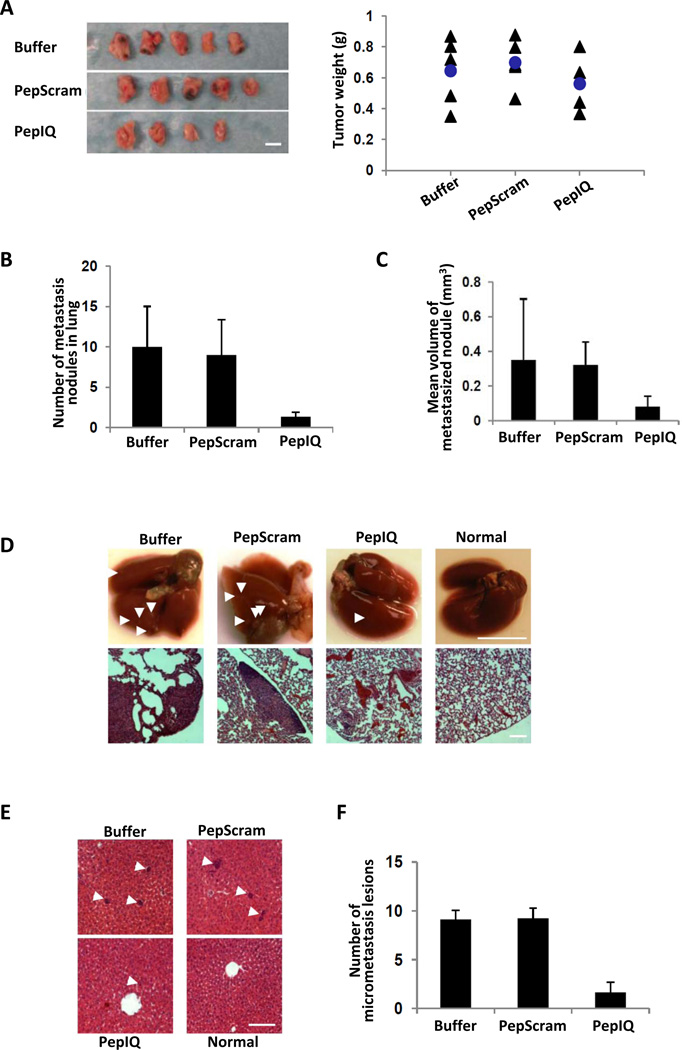
Figure 6. PepIQ inhibits metatstasis of 4T1 tumors.
(A) Pictures (Left) and weight (Right) of harvested 4T1 tumors after 26 days growth with 14 days treatment using the indicated peptides. (B) & (C) The numbers (B) and sizes (C) of the metastasis nodules in the lung of 4T1 tumor bearing mice that were treated by different peptides (indicated) by physical inspection. (D) (Upper) representative lungs collected from 4T1 tumor bearing mice that were treated by different peptides (indicated). Arrows indicate the metastasis nodules. (Bottom) Representative images of H&E staining of tissue sections of lungs from 4T1 tumor bearing mice that were treated by different peptides (indicated). (E) Representative images of H&E staining of tissue sections of livers from 4T1 tumor bearing mice that were treated by different peptides (indicated). Arrows indicate micrometastasis lesions. (F) The numbers of the micrometastasis lesions in the tissue sections of liver of 4T1 tumor bearing mice that were treated by different peptides (indicated). The numbers of micrometastasis lesion were counted by randomly selected 4 fields from randomly selected three tissue sections of each liver. The p values (between “pepscram” and “pepIQ”, p=0.297525 in A, between “pepscram” and “pepIQ”, p=0.005257 in B, between “pepscram” and “pepIQ”, p=0.038065 in C, and between “pepscram” and “pepIQ”, ***p=1.71745E−08 in F) are calculated by the pair-wise student t-tests. The scale bars in A represent 1 cm, in D, upper panel 1 cm, lower panel 200 µm. in E represent 200 µm.

