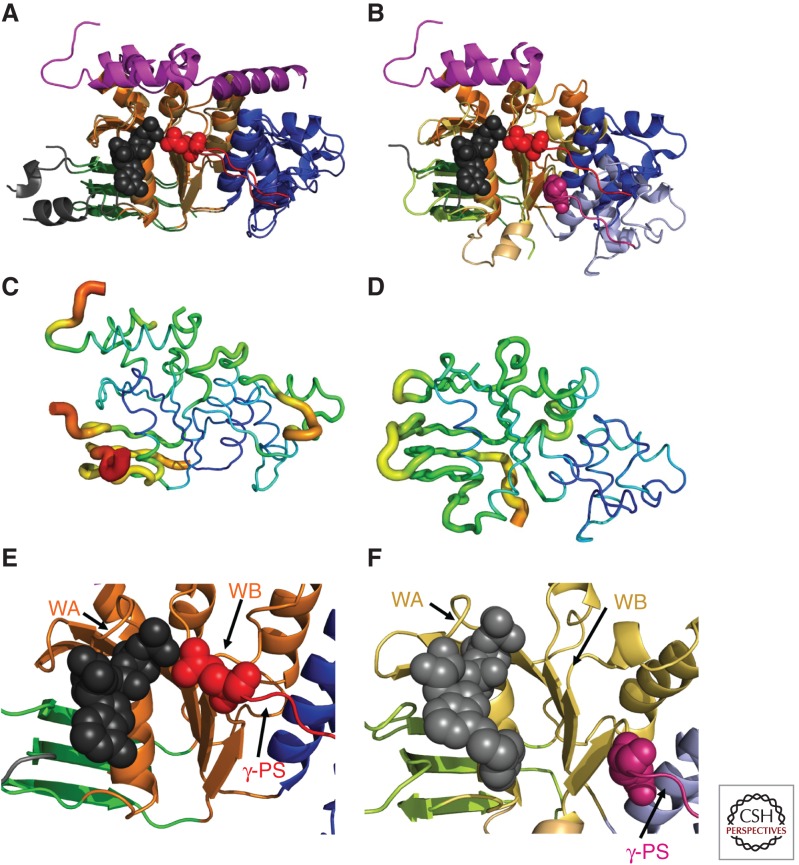
Figure 3.
Subdomain reorientation and backbone B-factors in hNBD1 and hNBD2 crystal structures. All panels show the hNBD1 (panels A, C, and E on the left and panel B on the right) and hNBD2 (panels B, D, and F on the right) domains in the same orientation after least-squares alignment of the β-strands in their ATP-binding cores (i.e., the ABCβ subdomain plus the F1-like core subdomain). The ribbon diagrams in panels A,B and E,F are colored equivalently to Fig. 1B,C (i.e., orange or yellow for the F1-like ATP-binding core subdomain, shades of blue for the ABCα subdomain, shades of green for the ABCβ subdomain, and red or magenta for the γ-phosphate switch or Q-loop). The bound ATP molecules (black or gray) and the invariant glutamines in the γ-phosphate switch (Q493 in hNBD1 in red and Q1291 in hNBD2 in magenta) are shown in space-filling representation. (A,B) Least-squares superpositions of two full-length F508-hNBD1 structures (panel A—PDB IDs 2BBO and 1 XMI) and of one of these with hNBD2 (panel B—PDB IDs 2BBO and 3GD7, respectively). The 7° rotation of the ABCα subdomain between the two hNBD1 structures shown here represents the largest displacement observed when comparing any two hNBD1 crystal structure, all of which have ATP bound in the active site. As discussed in the text, the 17° rotation and ∼10 Å displacement of the ABCα subdomain in hNBD2 relative to the ATP-bound conformation in hNBD1 likely prevents formation of a hydrolytically active ATP-sandwich heterodimer with hNBD1 in vitro, even though extensive evidence supports formation of such a complex coupled to opening of the CFTR channel in vivo (as schematized in Fig. 1D) (Gadsby 2004; Mense et al. 2006; Aleksandrov et al. 2008, 2009; Hwang et al. 2009). (C,D) Equivalent views of the hNBD1 (panel C) and hNBD2 (panel D) structures from panel B with the thickness and color of the backbone trace representing their mean backbone B-factors. B-factors quantify the variation or disorder in atomic position in a crystal structure, with larger B-factors indicating more disorder. The default encoding scheme in PyMOL was used to generate these images (i.e., 0.6–4.0 Å backbone thickness and a linear blue-to-green-to-red color ramp for B-factors running from 32–80 Å2 for hNBD1 and from 19–76 Å2 for hNBD2). (E,F) Close-up views of the ATP-binding sites in the crystal structures of F508-hNBD1-Δ(RI,RE) (panel E – PDB ID 2PZE) and hNBD2 (panel F – PDB ID 3GD7). Labels indicate the locations of the Walker A (WA) and Walker B (WB) motifs in the F1-like core subdomain and the γ-phosphate switch (γ-PS) linking the core subdomain to the amino terminus of the ABCα subdomain. Although hNBD1 is catalytically inactive, due at least in part to the substitution of a serine for the catalytic glutamate residue adjacent to the Walker B motif, its γ-PS adopts a catalytically active conformation in which its amino-terminal glutamine (Q493, red spheres) contacts the Mg2+ cofactor of ATP, as observed in ATP-bound structures of catalytically active NBDs from a wide variety of ABC transporters (Hung et al. 1998; Smith et al. 2002). In contrast, the γ-PS in hNBD2 adopts a different conformation resulting in an ∼17 Å displacement of the amide group of its amino-terminal glutamine (Q1291, magenta spheres) from the ATP molecule bound in the active site.

