Fig. 2.

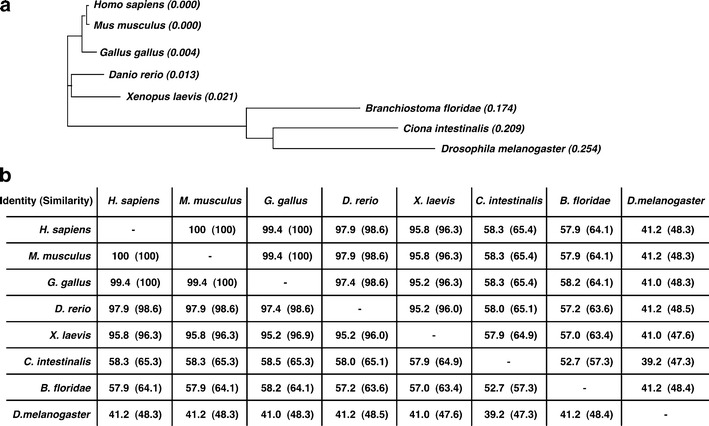
Illustration of the evolutionary relationship of Isl1 genes in different species. a The phylogenetic tree was generated using Clustal W (http://www.ebi.ac.uk/Tools/phylogeny/clustalw2_phylogeny/) (Chenna et al. 2003). Numbers indicate the genetic distance between the nodes of the tree. Sequences used were: NP_002193.2 (Homo sapiens), NP_067434.3 (M. musculus), NP_571037.1 (D. rerio), NP_990745.1 (G. gallus), NP_001104188.1 (X. laevis), AF226616_1 (Branchiostoma floridae), NP_001027767.1 (C. intestinalis), NP_476775.1 (D. melanogaster). b Comparison of Isl1 protein sequences. The percentages depict the degree of identical and similar (in parentheses) amino acids
