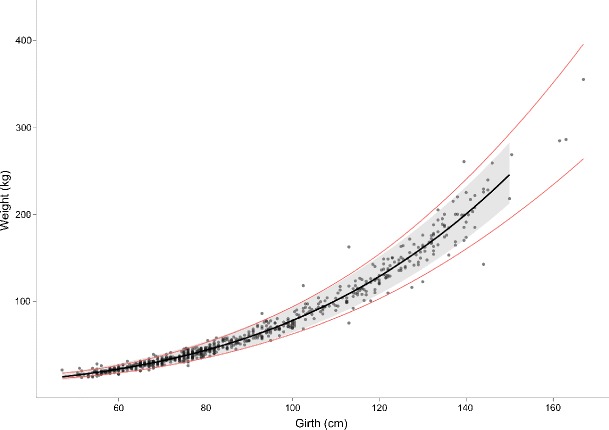
Fig. 3.

Complete data overlaid with the best fit model (thick solid line), 95 % prediction intervals (grey band) and the ±20 % body weight safe zone for dosing (thin solid lines). The model line and 95 % prediction intervals are those developed from the modelling data subset only
