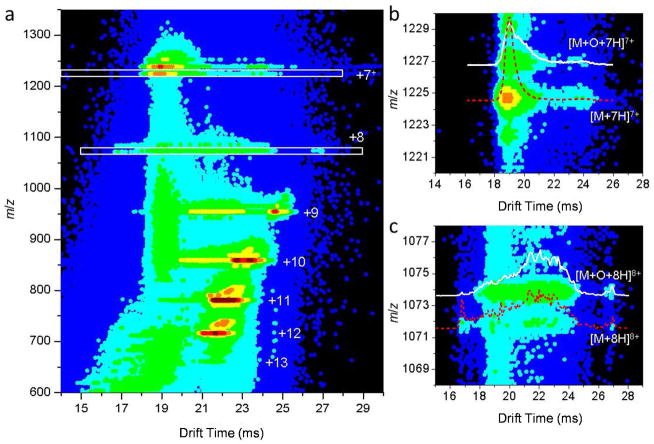
Figure 3.
(a) Two-dimensional drift time (m/z) contour plot for the Fe(II)/H2O2-induced oxidized ubiquitin electrosprayed from a solution of water and formic acid (pH 2; see Experimental). Ions of charge states from +7 to +13 are observed and each charge state has been provided as labels. To observe the features of charge states +7 and +8 more clearly, corresponding regions (marked by white boxes) have been zoomed in and displayed in (b) and (c), respectively. The unmodified ions are labeled as [M+7H]7+ (b) and [M+8H]8+ (c); the oxidized ions are labeled as [M+O+7H]7+ (b) and [M+O+8H]8+ (c). The insets in (b) and (c) show the drift time distributions for the corresponding ubiquitin species as labeled, which are normalized by the integrated peak intensity.

