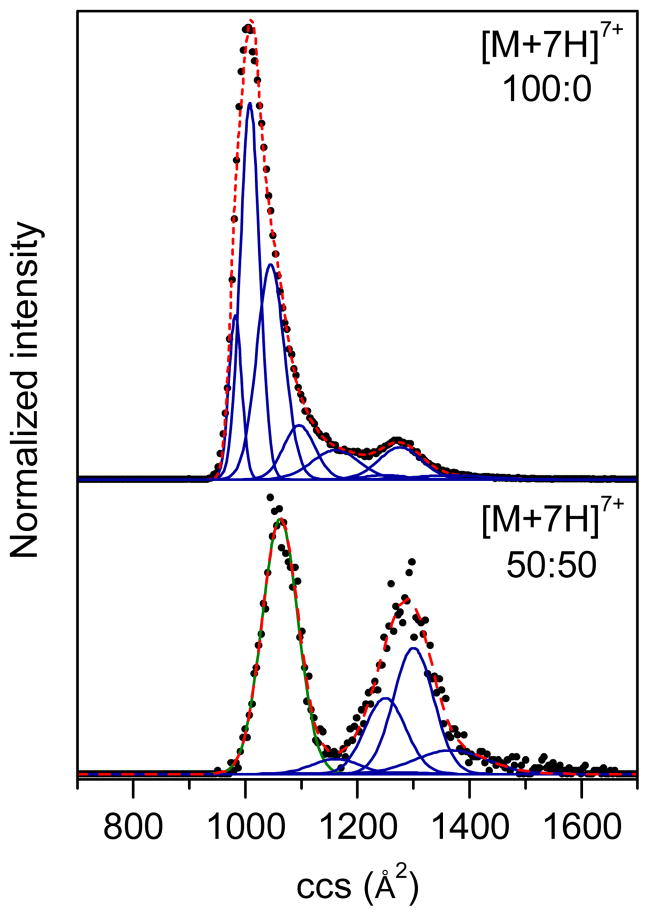
Figure 5.
Gaussian models of collision cross section (ccs) distributions for unprocessed ubiquitin of charge state +7 electrosprayed from two solution conditions (100:0 and 50:50 water:methanol, pH ~2 adjusted by formic acid). The solution conditions have been labeled. The experimental data (normalized) are drawn as black circles, the Gaussian distributions employed in the modeling are depicted as blue, green and pink solid lines, representing the N, A, and U state, respectively, and the sums of the Gaussian functions are shown as red dashed lines.

