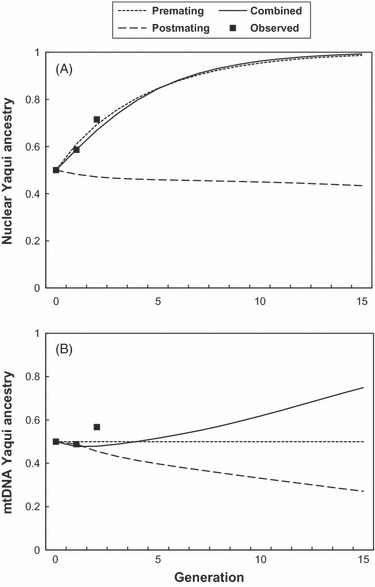
Figure 6.

The change in the frequency of Yaqui topminnow ancestry over time for (A) nuclear genes and (B) mtDNA. The closed circles indicate the average observed frequencies, and the predicted changes with only premating, only postmating, and combined premating and postmating are indicated by the short broken line, long broken line, and solid line, respectively (Hurt et al. 2005).
