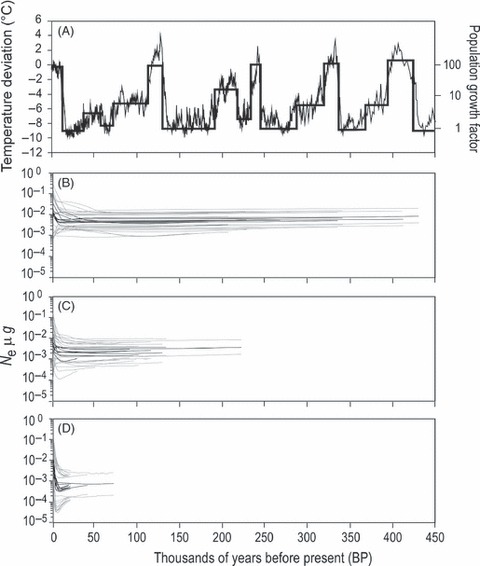
Figure 6.

Simulations of historical demography in red king crab. (a) Late Pleistocene demographic model based on climate temperatures estimated from oxygen isotopes in Antarctic ice cores (Jouzel et al. 2007). Effective population sizes vary over two orders of magnitude between glacial maxima and interglacial warmings. (b) Simulations of NW Pacific and N Bering Sea populations. Bayesian skyline plots (BSPs) of 10 replicate samples of sequences (n = 200 for each sample) simulated with the program Mesquite, using coalescence, and assuming a base effective population size of Ne = 800 000 and a scaling factor (approximate mutation rate) = 5 × 10⁻⁹. Bold curves present the Bayesian estimates of historical population size, and gray curves present the 95% highest probability densities. (c) Simulations of SE Bering Sea and western Gulf of Alaska populations. BSPs of 10 replicate simulated samples as in 6b, except Ne = 400 000 and scaling factor = 3 × 10⁻⁹. (d) Simulations of SE Alaska populations. BSPs of 10 replicate simulated samples as in 6b, except Ne = 100 000.
