
Figure 7.
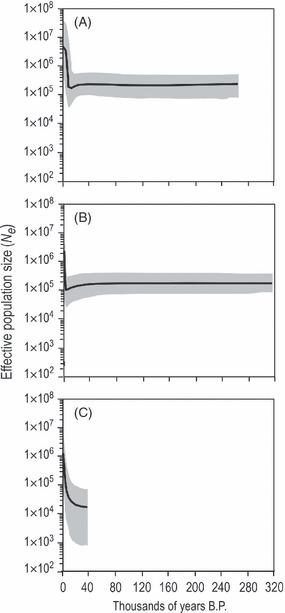
Bayesian skyline plots (BSPs) of three major evolutionary groups of red king crab in the North Pacific and Bering Sea. Substitution rate was estimated to be 5 × 10⁻⁹ from the position of the postglacial inflection in the population growth curve and was used to scale Ne on the y-axis. (a) Okhotsk Sea–Norton Sound–Adak Island, (b) SE Bering Sea and western Gulf of Alaska, (c) SE Alaska.