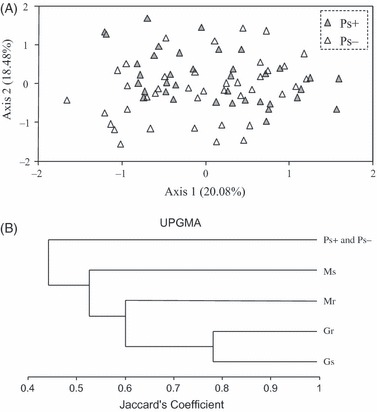
Figure 2.

Principal coordinate analysis (A) made with 38 and 40 Lolium multiflorum plants from the Pampean populations Ps+ and Ps−, respectively (the proportion of the variance explained by each axis is indicated between parentheses). Cluster analysis (B) built with the UPGMA algorism that estimates the genetic distance among L. multiflorum parent populations (Ps+, Ps−, Ms, Mr, Gs, and Gr).
