
Figure 2.
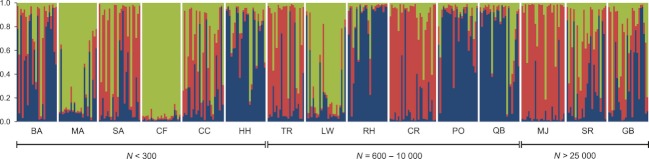
Results of the structure analysis for 15 populations of Rutidosis leptorrhynchoides. The optimal number of genetic clusters (K) is three following the ΔK method of Evanno et al. (2005). Each bar represents a single individual and its proportional membership to the three clusters. Populations are ordered by increasing population size from left to right.