
Figure 4. Spatial reorganization of subthreshold responses.
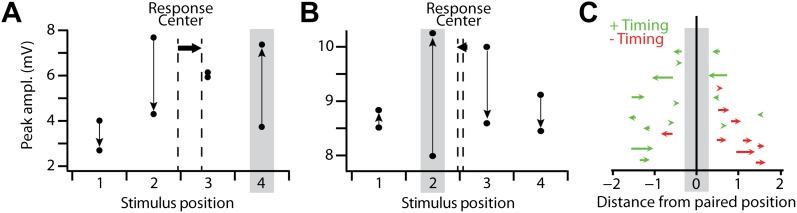
(A) Mean amplitude of the subthreshold response peak in a single recording with a positive timing induction, for all stimulus positions before and after pairing. Grey box indicates the pairing position, vertical arrows indicate the direction of the change from before to after pairing, and dashed vertical lines the subthreshold stimulus response center before and after pairing, which shifted from position 2.44 to 2.89 (horizontal arrow). (B) As in (A), but for a recording in which subthreshold responses at the pairing position transitioned from weakest of the four positions to strongest after pairing; response center shifted from 2.55 to 2.46. (C) Shifts in the subthreshold stimulus response center after stimulus-AP pairing, for positive timing inductions (green) and negative timing inductions (red). Each arrow indicates the response center positions before and after pairing for a single experiment with positive (green) or negative timing (red). Vertical positions of arrows are arbitrary.