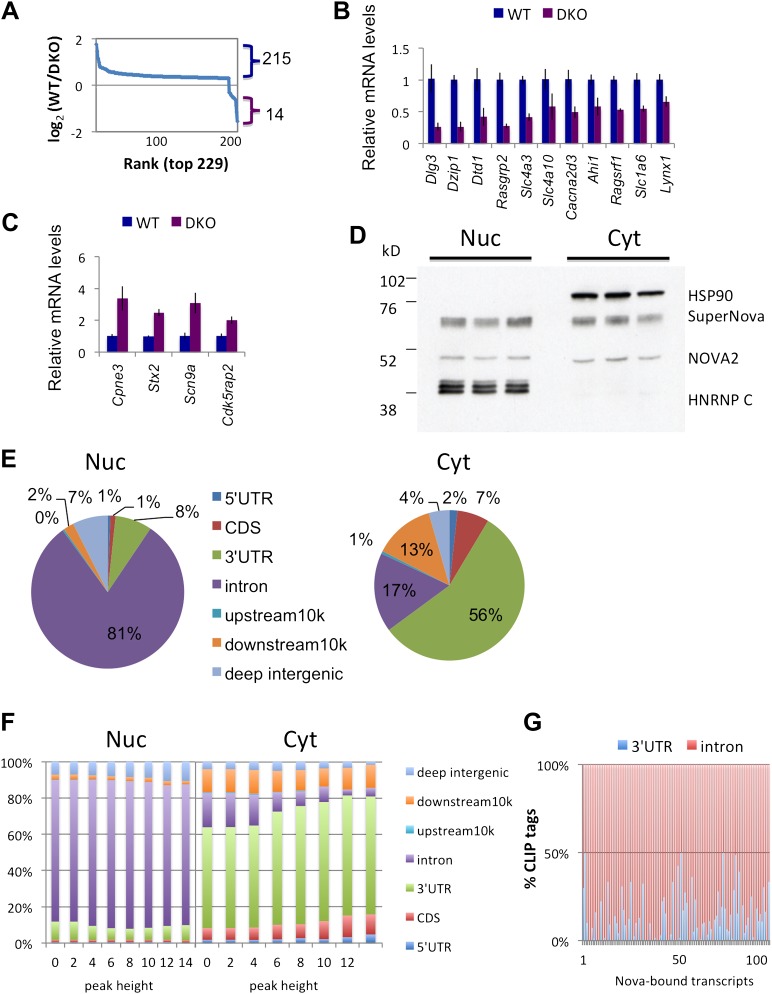
Figure 1. NOVA proteins up/down-regulate transcript levels.
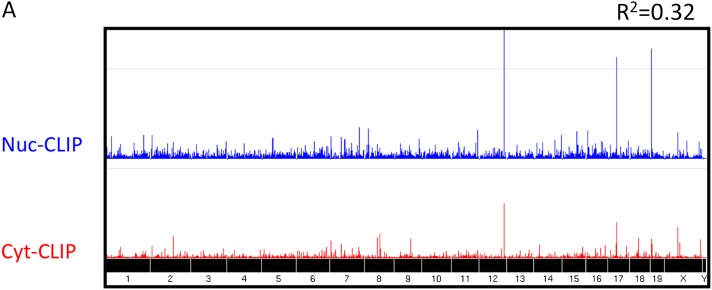
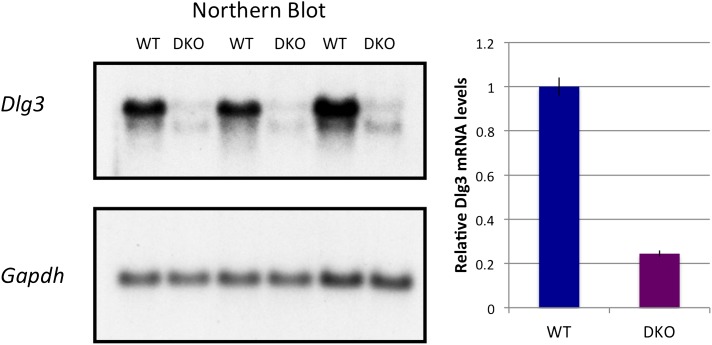
(A) Affymetrix exon arrays were interrogated with RNA from WT vs DKO E18.5 mouse whole brains, and normalized transcript intensities were plotted in log2 scale (log2(WT/DKO) > 0.3 or −0.3 and p<0.05). The X-axis indicates ranks of transcripts from the top and Y-axis is the measure of relative transcript levels (WT/DKO) in log2 scale. Blue bracket represents transcripts whose levels are increased in WT relative to DKO brain (NOVA-dependent ‘upregulation’ of steady-state mRNA levels), and the purple bracket represents down-regulated transcripts in WT relative to DKO (NOVA-dependent repression of steady-state mRNA levels). (B),(C) qRT-PCR data of representative NOVA regulated transcripts. Y-axis represents the mRNA levels in which WT is normalized to 1.0. Data is from three biologic replicates (three animals) and three technical replicates (nine reactions per point); error bars represent standard deviation. For each point p<0.001; see Table 1 for additional data. NOVA up-regulated transcripts in WT versus DKO (B; corresponding to blue bracket in Figure 1A) and NOVA down-regulated transcripts (C; corresponding to purple bracket in Figure 1A) are shown. (D) Immunoblot analysis of NOVA distribution in nuclear and cytoplasmic fractions from mouse brain irradiated by UV. Each lane represents the different brain extracts as biological replicates. HSP90 is used as a cytoplasmic marker, and hnRNP-C1/C2 as a nuclear marker. The NOVA2 antibody detects both large and small NOVA2 isoforms (Yang et al., 1998). (E) Breakdown of BC = 4 clusters for nuclear and cytoplasmic Nova HITS-CLIP. Downstream 10K clusters are enriched in unannotated 3′ UTRs (Licatalosi et al., 2008); see also Table 2. (F) Distribution of BC = 4 clusters by peak height for both nuclear and cytoplasmic HITS-CLIP; more stringent cytoplasmic clusters show enrichment in 3′ UTR. (G) Distribution of CLIP tags (intronic, red; 3′ UTR, blue) from the list of NOVA up-regulated RNAs. Each point on the X-axis represents a Nova-dependent gene (in arbitrary order) and Y-axis represents the percentage of intronic/3′ UTR tags for transcripts with total tags >5.


