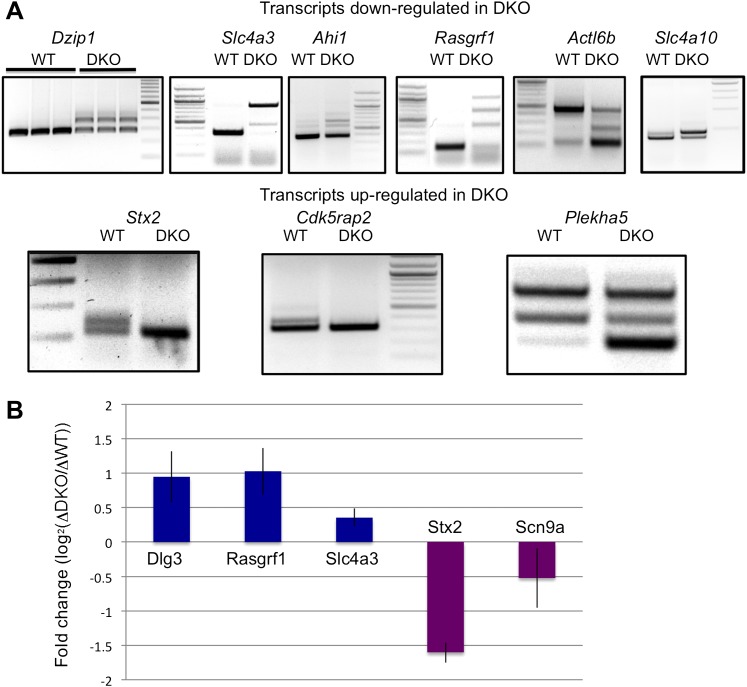
Figure 5. NOVA regulates cryptic NMD exons and transcript levels.
(A) Analysis of alternative spliced isoforms in transcripts chosen solely on exon array data showing NOVA-dependent steady-state mRNA changes and robust HITS-CLIP clusters in introns. Transcripts were then screened for the presence of cryptic NMD exons by RT-PCR using primers in exons bounding the intronic HITS-CLIP clusters. Data is divided into those transcripts down-regulated or up-regulated in Nova DKO, as indicated. Sequence analysis of RT-PCR products showed the presence of cryptic exons harboring premature stop codons (Figure 3—source data 1; Supplementary file 2). A diagram of the loci of each NMD exon present in Figure 5A is shown in Figure 5—figure supplement 1. For example, most transcripts down-regulated in Nova DKO brains show a larger, PTC containing exon in DKO; one exception is Actl6b, in which in the absence of NOVA there is a PTC, and in WT brain, an upper alternate isoform (exon) is present that corrects that frame-shift; (B) Effect of emetine on putative NOVA-regulated cryptic NMD exons. The steady-state level of six transcripts identified in Figures 3B, 4C and 5A were assessed by qRT-PCR in six DIV WT vs Nova DKO primary mouse neurons incubated for 10 hr in the presence or absence of emetine. The results were plotted with the Y-axis as a measure of the degree of putative NOVA-dependent NMD regulation (the fold change of transcript levels in DKO neurons in the presence or absence of emetine, divided by that of WT, in log2 scale). For example, for Dlg3 the log2 value is about 1.0 indicating that emetine treatment increased the Dlg3 NMD-isoform in DKO neurons relative to WT neurons by a factor of two, while emetine decreased the NMD isoform of Scn9a by ∼1.4-fold, leading to decrease or increase in the respective proteins in Nova DKO neurons (Figures 2 and 3 or Figure 4, respectively). Three independent experiments were performed and error bars represent standard deviation (p<0.05).


