Fig. 4.

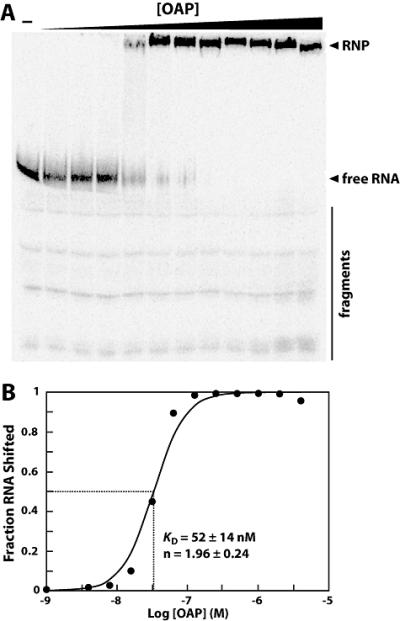
OLE and OAP form a ribonucleoprotein complex. (A) 5′ 32P-labeled OLE1-637 RNA was subjected to electrophoretic mobility shift assays with increasing concentrations of N-terminal histidine-tagged OAP to assess ribonucleoprotein complex formation. Arrowheads denote free, full-length RNA and shifted RNA (RNP) as noted. A bar highlights residual 3′ degradation products (fragments). These degraded RNAs do not shift in mobility in response to OAP. (B) To determine the binding characteristics of OAP, the fraction OLE RNA shifted was plotted versus the logarithm of the concentration of OAP. The data depicted is a representative and plots data calculated from the gel shown in part A. The KD and Hill coefficient (n) were calculated from four separate experiments, and the average and standard error are listed on the graph.
