
Figure 1.
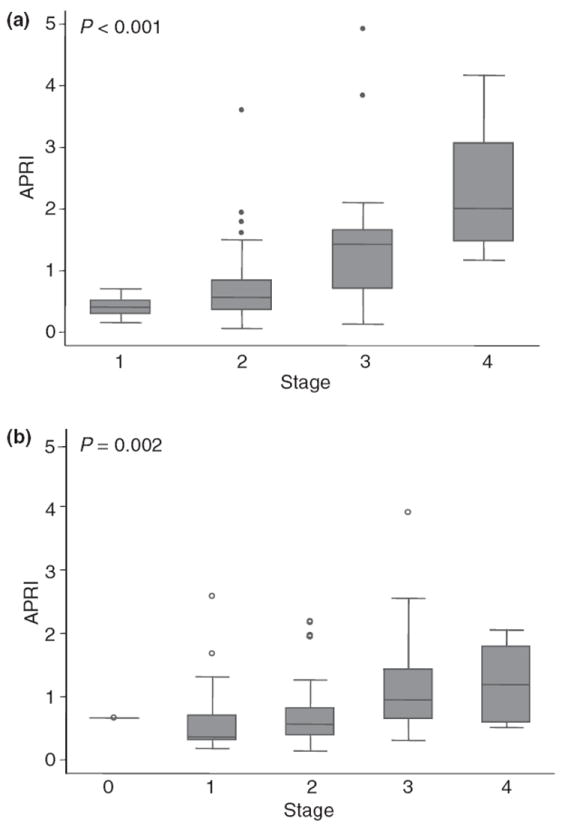
Box plot of APRI values by stage of fibrosis in HCV mono-infected patients (a) and in HCV/HIV co-infected patients (b). Horizontal lines within the boxes indicate median values. Lower and upper box limits indicate the 25th and 75th percentiles, and the vertical bars indicate lower and upper adjacent values. Dots indicate outside values.