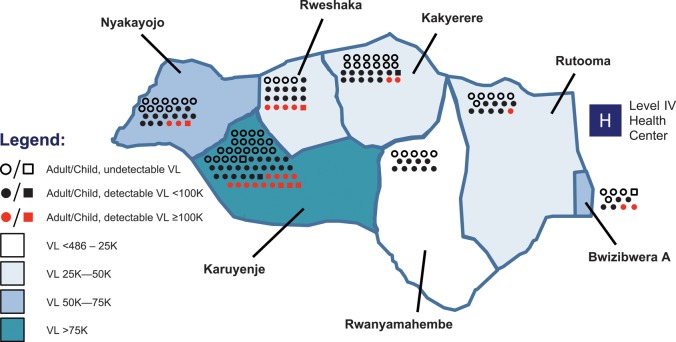
Figure 2.
Geographic mapping of mean human immunodeficiency virus (HIV) RNA levels among 165 individuals with undetectable, midrange, and high levels of HIV-1 plasma RNA within villages of a rural parish of southwestern Uganda. Mean viral load (VL) for each of 7 villages (names given) within the parish are displayed in 4 categories. Individual adults (circles, n = 156) and children aged <15 y (squares, n = 9) are depicted in each region according to VL as follows: undetectable (486 copies/mL) VL (open circles/squares), detectable VL <100 000 copies/mL (black circles/squares), detectable VL ≥100 000 copies/mL (red circles/squares). The location of the parish's level IV government health center is marked at the eastern boundary of the region (white letter “H” in blue square). Abbreviation: VL, viral load.

