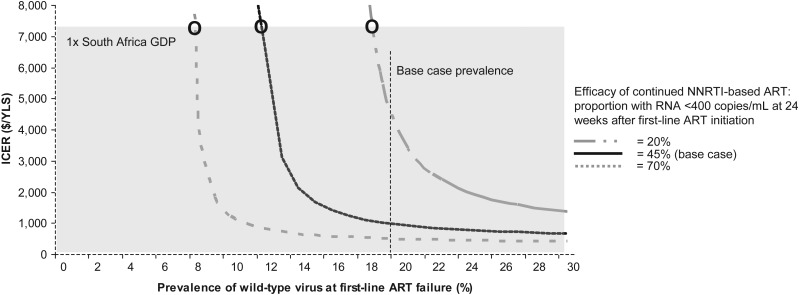
Figure 2.
Two-way sensitivity analysis to examine the impact of prevalence of wild-type (WT) virus at first-line antiretroviral therapy (ART) failure and efficacy of continued nonnucleoside reverse transcriptase inhibitor (NNRTI)–based ART on suppressing human immunodeficiency virus RNA to <400 copies/mL at 24 weeks. The vertical axis represents the incremental cost-effectiveness ratio (ICER) of genotype compared with no genotype. The horizontal axis represents the prevalence of WT virus at first-line ART failure. Combinations of efficacy of continued NNRTI-based ART and prevalence of WT virus that yield ICERs above and to the left of the marked efficacy curves represent scenarios where genotype is “dominated” by no genotype, and the horizontal axis extends beyond the 30% mark to represent scenarios where genotype is very cost-effective compared with no genotype. The solid curve represents the base-case efficacy of continued NNRTI-based ART assuming a 3-month genotype-associated delay in care. The shaded gray region represents cases where the ICER of genotype is ≤1 times the South Africa gross domestic product ($7100) and very cost-effective. Circles represent the threshold prevalence of WT virus below which genotype becomes very cost-effective. Abbreviations: ART, antiretroviral therapy; GDP, gross domestic product; ICER, incremental cost-effectiveness ratio; NNRTI, nonnucleoside reverse transcriptase inhibitor; YLS, years of life saved.

