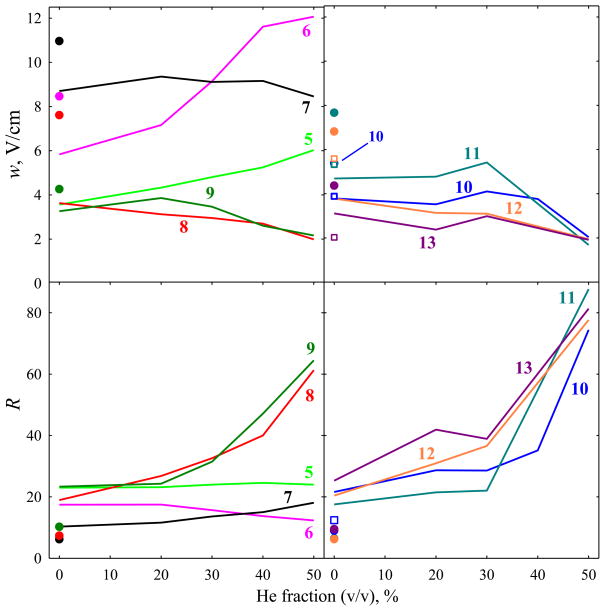
Fig. 2.
Peak widths and resolving power values for the major features in ubiquitin ion spectra with z = 5 – 9 (left column) and z = 10 – 13 (right column): lines and circles for the data in Fig. 1 with planar and cylindrical FAIMS devices, respectively; squares for the data obtained (for z = 10 – 13) using a planar analyzer with ED = 20 kV/cm and N2 in Ref. [29].

