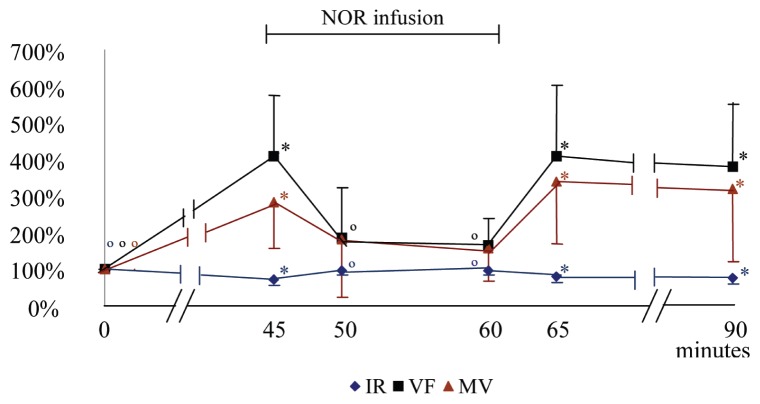
Figure 5.
Mean (± SD) of the variation percentage of the resistivity index (RI), volumetric flow (VF), and mean velocity (MV) of the median artery before, during, and after norepinephrine infusion (NOR). At 0 minutes acepromazine at 0.1 mg/kg BW was administered intravenously; from 45 to 60 minutes the norepinephrine (NOR) infusion was administered at 1 μg/kg BW/minute.
* significantly different from T0. ∘ significantly different from T45.

