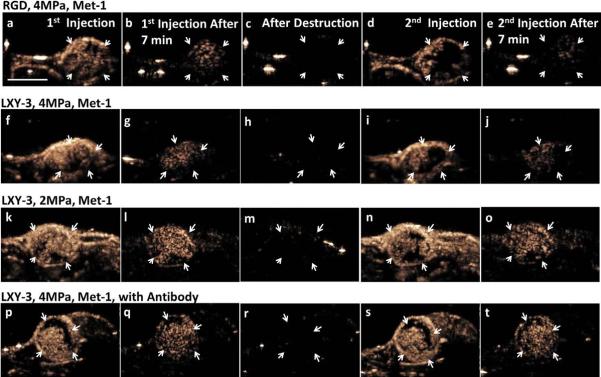
Figure 2.

Four example image sets are shown to represent alteration of Met-1 tumor blood flow in various scenarios. cRGD-conjugated microbubbles were injected in the first row, whereas LXY-3-conjugated microbubbles were injected in the rest rows. Frame-to-frame averaged CPS images were acquired 30 seconds (a, f, k, p) and 7 minutes after the first injection (b, g, l, q), after microbubble destruction at 7.5 minutes (c, h, m, r), and 30 seconds (d, I, n, s) and 7 minutes after the second injection (e, j, o, t), respectively. Orange pixels represent CPS enhancement (the presence of the microbubbles in the imaging plane). With 4 MPa insonation of bound microbubbles, the difference between the averaged CPS images of flowing microbubbles acquired 30 seconds after the first injection (a, f) and the second injection (d, i) delineates the region with a change in blood flow in the tumor region (indicated by white arrows). The generation of additional regions with reduced flow was further verified by comparing the 7-minute CPS images of bound microbubbles between the first (b, g) and the second (e, j) injection. The reduction of tumor blood flow was also observed after bound microbubble destruction by 2 MPa insonation (k–o). With pre-treatment of anti-CD41 antibody 50 minutes before microbubble injection, bound microbubble destruction by 4 MPa insonation did not reduce tumor blood flow (p–t). The scale bar represents 5 mm.
