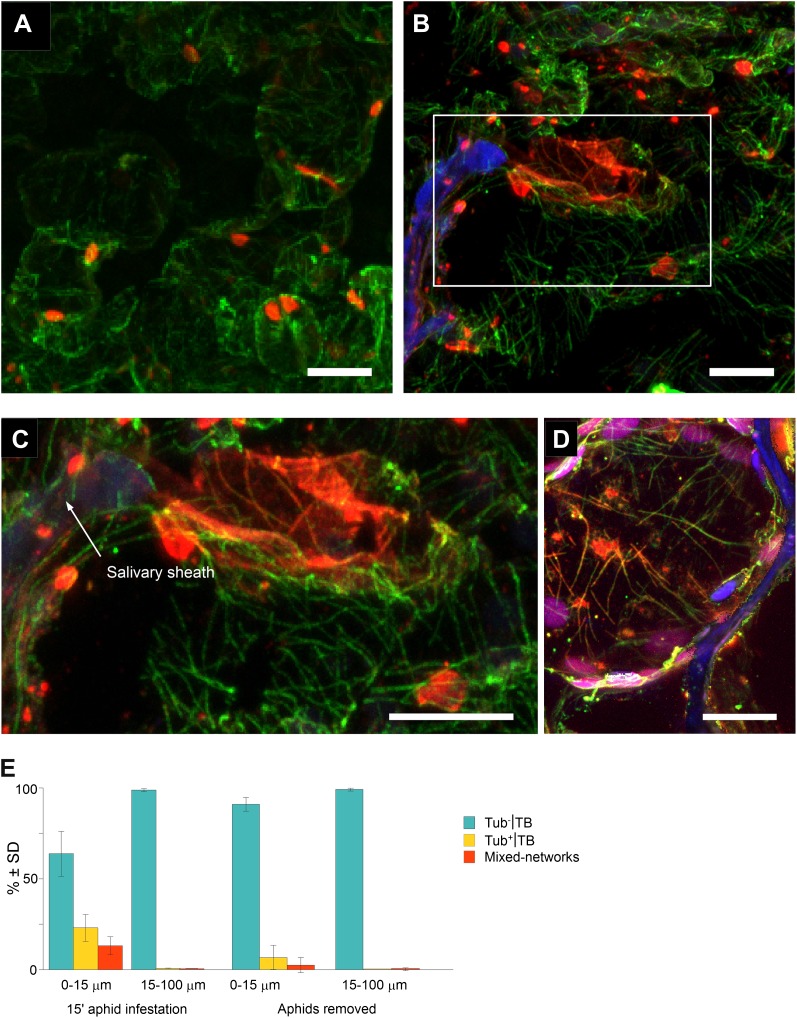
Figure 8. Mixed-networks appear in tissue zones pierced by aphid stylets.
Unstressed CaMV-infected leaves (A) or leaves infested by aphids for 15 min (B–D) were analyzed by immunofluorescence microscopy. (A) Cells in leaf regions that were not foraged by aphids display standby Tub−|TBs, as shown by confocal projections of tissue sections labeled against P2 (red) and α-tubulin (green). The optical single sections used for this projection are deposited in Figure 8—source data 1. (B) In contrast, a cell close to a salivary sheath (blue autofluorescence, digitally enhanced) displays mixed-networks, in aphid-infested tissue. An enlargement of the zone enclosed in (B) is shown in (C). (B–C) show confocal projections, please refer to Figure 8—source data 2 for the corresponding image stack. (D) Immunofluorescence microscopy against capsid protein P4 (red) and α-tubulin (green) shows that virus particles also localize to mixed-networks in cells close to salivary sheaths (blue, digitally enhanced). Chloroplast autofluorescence appears in magenta. The confocal single sections used to produce this projection can be found in Figure 8—source data 3. (E) Aphids trigger TB transformation, and this transformation is reversible. Aphids were placed for 15 min on infected leaves. Following this, the leaves were fixed immediately and processed for immunofluorescence (15-min aphid infestation), or the aphids were removed and the leaves were processed 2 h later (Aphids removed). The TB phenotype (standby Tub−|TBs, Tub+|TBs and mixed-networks) was scored next to salivary sheaths (0–15 μm) and in surrounding tissue (15–100 μm). Tub+|TBs and mixed-networks were predominantly observed close to salivary sheaths in freshly aphid-infested tissue. The effect was highly significant (p<0.0001, GLM, df = 1, χ2 = 194.59, n = 3). Tub+|TBs and mixed-networks reverted back to ‘stand-by’ Tub−|TBs 2 h after aphid removal, indicating that TB activation is reversible. This effect was also highly significant (p<0.0001, GLM, df = 1, χ2 = 17.98, n = 3). SD in (E): standard deviation from three independent experiments. A total of 969 TBs surrounding 42 sheaths were counted from freshly aphid-infested tissue, and 194 TBs surrounding eight sheaths were counted in the ‘aphids removed’ experiments. Original data can be found in Figure 8—source data 4.
DOI: http://dx.doi.org/10.7554/eLife.00183.033

