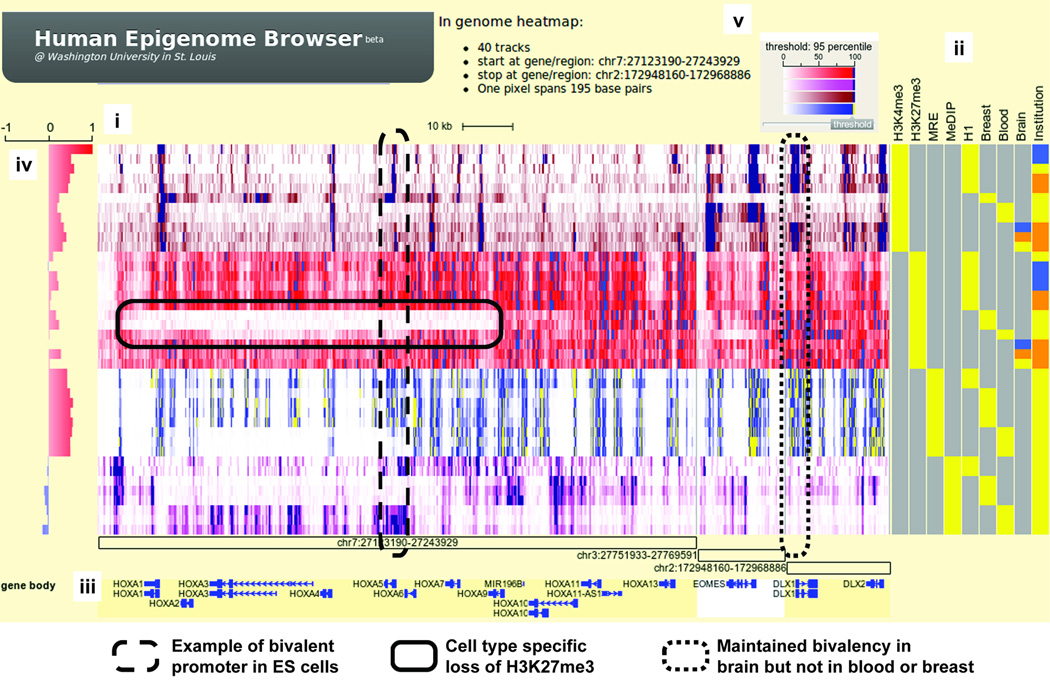
Figure 1.
Epigenomic landscape of bivalent domains. (i) Genomic heatmap of 36 datasets over three regions. Green: H3K4me3 ChIP-seq; Red: H3K27me3 ChIP-seq; Brownish-red: MRE-seq; Pink: MeDIP-seq. (ii) Metadata heatmap. Epigenetic marks and sample types are in different feature columns. For brain, yellow: substantia nigra; orange: hippocampus (middle portion); blue: anterior caudate. For institution, yellow: UCSF; blue: UCSD; orange: Broad Institute. (iii) Annotation tracks. Genomic coordinates of three regions are labeled with open boxes. Known genes are diagramed. (iv) Statistical correlation track. Pearson correlation coefficients were calculated between H3K4me3 track of H1 ES cell and all other tracks. (v) Color gradient scheme for genomic heatmap. In addition, green dashed-box highlights a bivalent promoter in H1 ES cells. Blue dashed-box highlights cell type specific loss of H3K27me3 compared to ES cells. Red dashed-box highlights a promoter whose bivalency is preserved in ES cells and in brain samples, but not in breast or blood.

