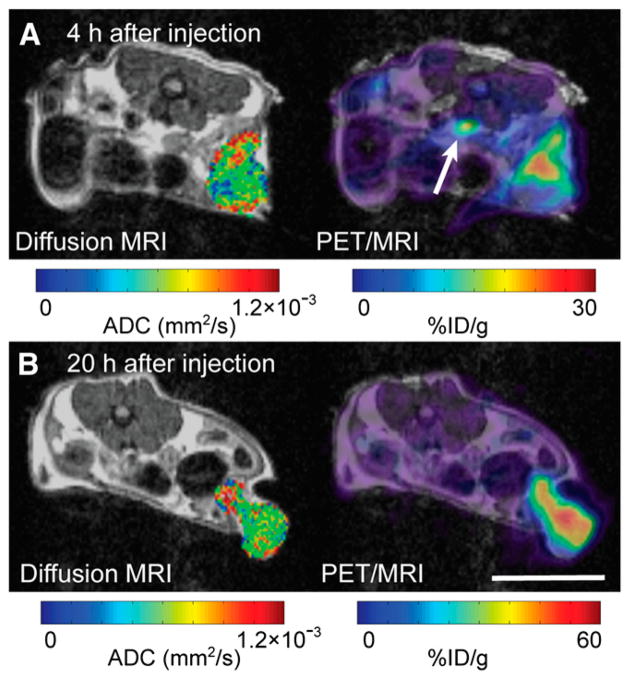
FIGURE 5.
In vivo simultaneous diffusion-MRI/radiolabeled antibody PET reveals phases of antibody uptake. PET/MRI of mouse was obtained at 4 (A) and 20 (B) h after injection. Slices from 2 time points were matched as closely as possible. Both PET and diffusion MRI show intratumoral heterogeneity of uptake and ADC values, respectively. General accumulation of antibody was observed between 4 and 20 h. Focal distribution of antibody was observed in more dorsal portion of tumor at 4 h after injection; by 20 h, distribution encompassed most of tumor mass. Spatial patterning of ADC (shown only for tumor) was similar at both time points. PET images were calibrated using linearity phantom as described in supplemental data. Arrow points to inferior vena cava (scale bar = 10 mm).

