
FIGURE 6.
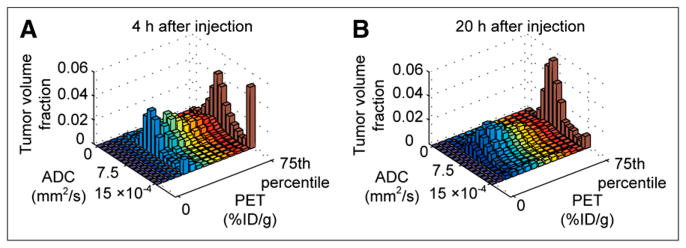
Cooccurrence matrix analysis of functional PET and MRI data offers insight into tumor antibody uptake. (A) Cooccurrence matrix comparing antibody uptake and ADC values at 4 h after injection. Uptake comparison window was adjusted to account for lower spatial resolution of PET (1.5 mm in FWHM), compared with MRI. At 4 h, large fraction of antibody signal colocalized with regions of high ADC (≥0.0015 mm2/s), suggesting much of the antibody was in vascular or interstitial spaces. (B) By 20 h, that component had disappeared; antibody was spread more evenly across tumor mass. This was not apparent with pixel-by-pixel matching (Supplemental Fig. 4).