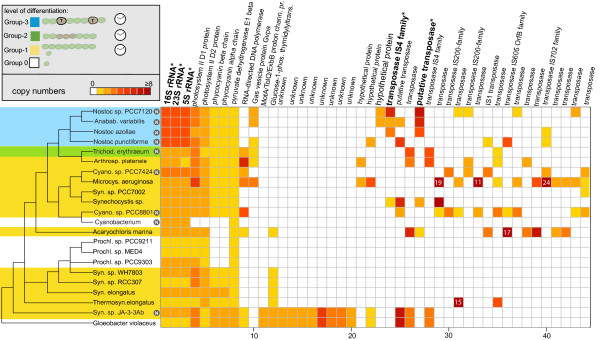
Figure 1.

Conserved paralogs in cyanobacteria. Distribution of gene copy numbers within and across cyanobacterial genomes. On the left side cyanobacterial cladogram is shown, emphasizing the different morphological groups. Species of group G1 exhibiting circadian rhythm are displayed in a yellow box. Trichodesmium exhibiting reversible differentiation is shown in a green box (group G2) and cyanobacteria of group G3 which are able to terminally differentiate, are displayed in a blue box. The letter ‘N’ marks species capable of nitrogen fixation. Conserved copy numbers of genes are shown in a color plot ranging from yellow indicating a single gene to dark red denoting 8 copies or more. In cases where gene copy numbers exceed 8, values are given in white letters. Corresponding species names are written on the left and gene names are written on top. Copy numbers of genes displayed in bold and marked by a “*” are positively correlated to terminal differentiation.
