
Figure 1.
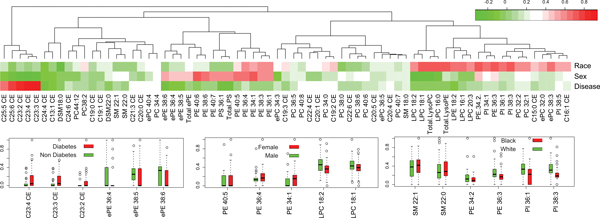
Factor analysis of lipidomic profile. The upper panel is a heatmap of factory analysis. Factor loadings, where race, sex, and disease correspond to the three factors. Color depth represents for factor loadings of 71 different lipid indicators, positive loading were shown in red and negative loadings in green. The lower panel is a boxplot of the important loading lipid for three known factor, including diabetes, sex and race. The lipid levels were scaled to the range 0 to 1, and each lipid corresponds to two boxes with different factor levels.