
Figure 2.
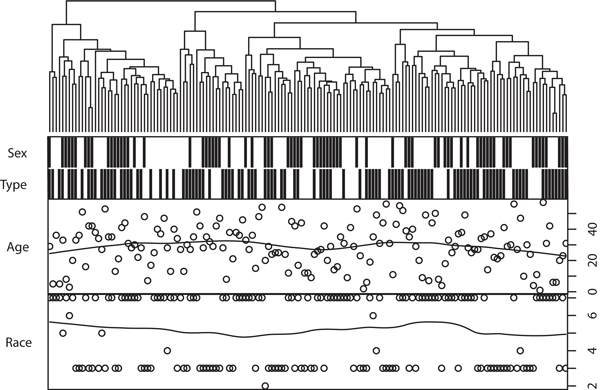
Hierarchical clustering of all samples in filtered data set. Factors such as sex and type were represented by black or white blocks: female was in white, male in black; diabetes in black, non-diabetes in white; Asian as 2, blacks as 3, Indian as 4, Mexican as 5 and 6, whites as 7.