
Figure 4.
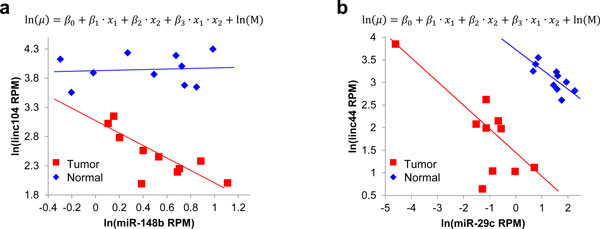
MiRNA and lincRNA expression show different relationship between cancer and normal tissues. X axis denotes miRNA expression. Y axis denotes lincRNA expression. Blue and red dots are for normal and tumor samples, respectively. (a) Hsa-miR-148b down-regulate linc104 in tumor samples, but not in normal samples. The coefficient of interaction item is significant. (b) hsa-miR-29c down-regulate linc44 in both normal and tumor samples. The coefficient of interaction item is not significant.