
Figure 1.
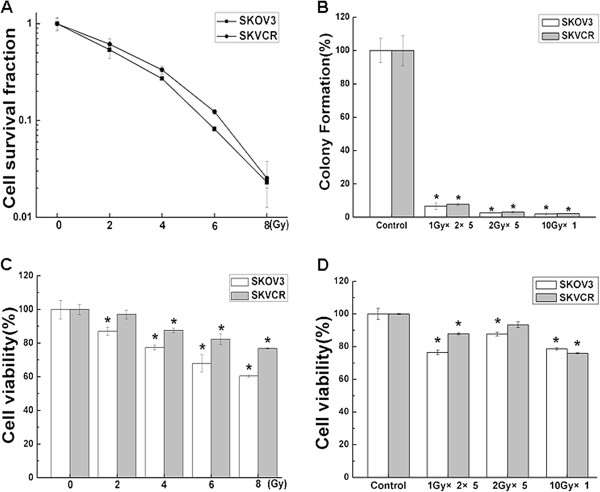
The radiosensitivity in Human ovarian carcinoma cell lines SKOV3 and multidrug-resistant phenotype SKVCR cells. (A) Colony formation assay was used to detect the survival curve, and Multi-target click model of GraphPad Prism 5.0 (Systat Software, USA) was used to fit cell survival curves. SKOV3: D0= 3.37,Dq=0.60, n=1.508; SKVCR: D0= 4.18, Dq=1.05, n=1.78. (B) SKOV3 and SKVCR cells were exposed to different radiation formulae (0Gy,1Gy×2×5,2Gy×5,10Gy×1), cell viability was analyzed by the Colony formation assay. (C) Dose-effects analysis in SKOV3 and SKVCR cells by CCK-8 assay. (D) SKOV3 and SKVCR cells were exposed to different radiation formulae (0Gy,1Gy×2×5, 2Gy×5, 10Gy×1 ), cell viability was analyzed by CCK-8 assay. *P<0.05, vs sham-irradiated.