
Figure 3.
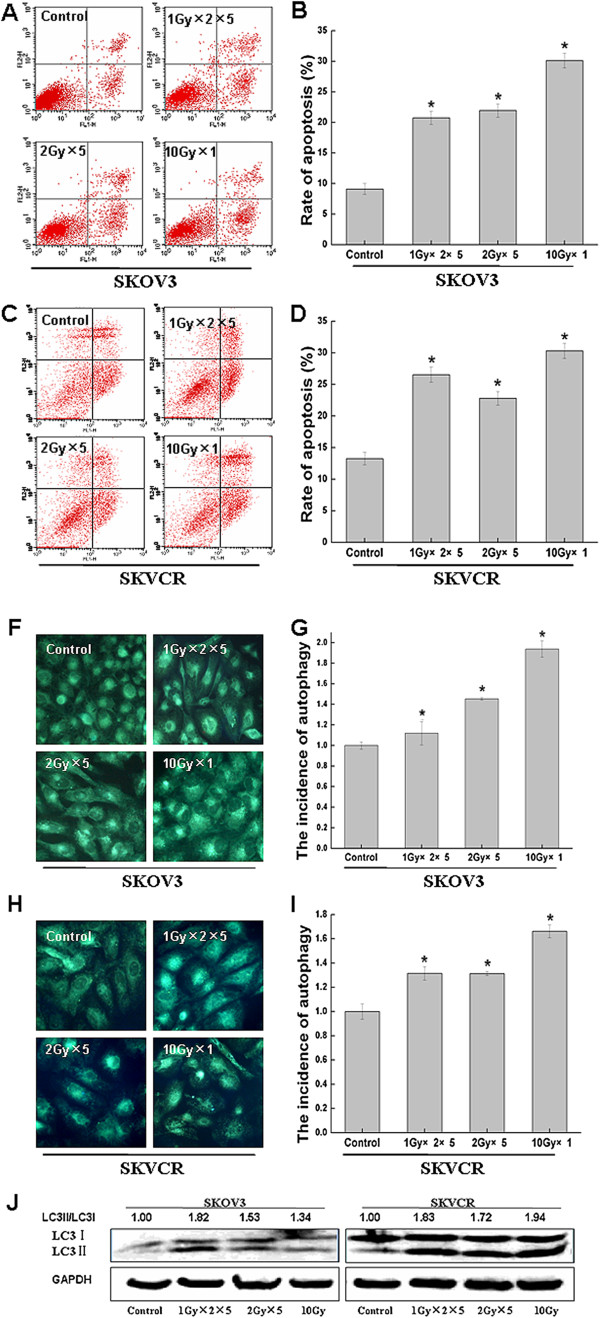
The changes in apoptosis and autophagy after the treatment of irradiation in SKOV3 and SKVCR. (A,C) Flow cytometry was use to quantitative the apoptotic rate in SKOV3 and SKVCR. (B,D) Statistical analysis of apoptotic rate. Results were expressed as the percentage of untreated cells, Mean ± SD of thrice. *P<0.05, vs sham-irradiated. (F,H) MDC staining was used to detect the morphologic changes of autophagy in SKOV3 and SKVCR. (G,I) Statistical analysis of autophagic rate based on MDC staining, Mean ± SD of ten vision fields. *P<0.05, vs sham-irradiated. (J) Western blot was used to detect MAPLC3, the increase of MAPLC3II suggested the autophagy occurrence.