
Figure 6.
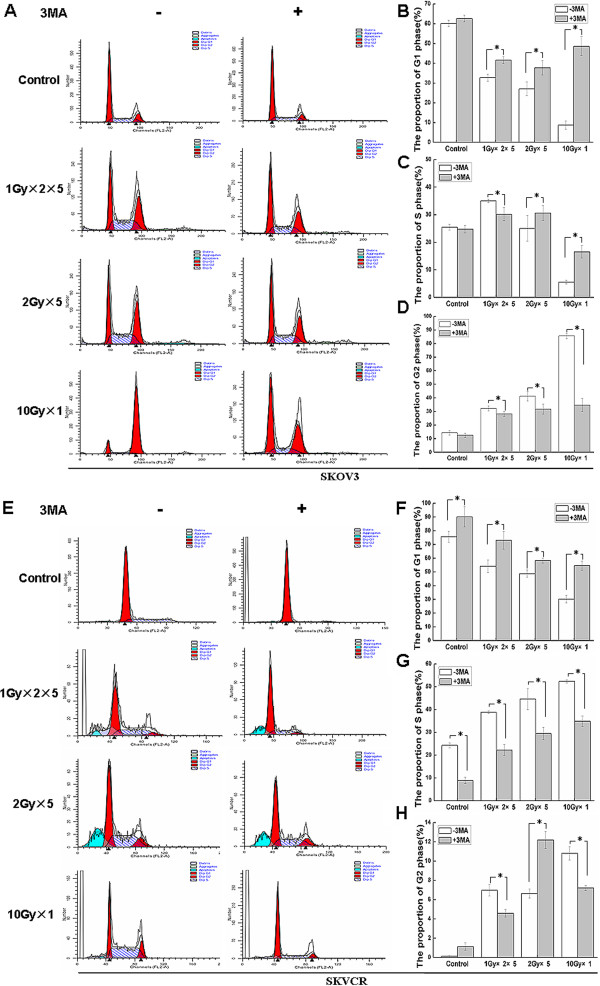
Autophagy inhibition attenuates IR-induced cell cycle arrest. (A) Flow cytometry was used to quantitative the cell cycle rate with or without autophagy inhibitor, 3MA (5 mM), with or without indicated IR regimens at 24 h in SKVO3; SKOV3 cell population (%) in G1 phase (B), S phase (C), G2 phase (D) were quantified. (E) Flow cytometry was use to quantitative the cell cycle rate with or without autophagy inhibitor, 3MA (5mM, with or without indicated IR regimens at 24 h in SKVCR. SKVCR cells were treated with IR or a combination of both (5 mM 3MA followed by IR) for 24 h, SKVCR cell population (%) in G1 phase (F), S phase (G), G2 phase (H) were quantified. All data are representative of three independent experiments and are shown as the mean ± SD. *P<0.05. vs untreated 3MA group.