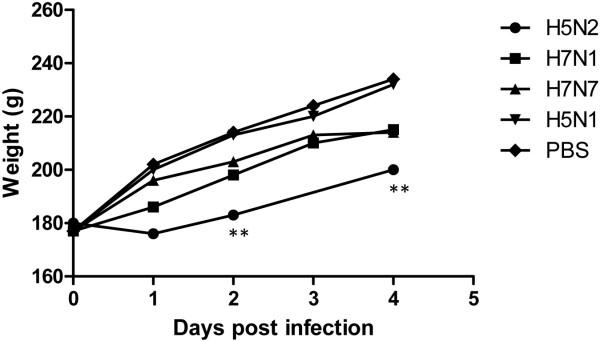
Figure 3.

Weight gain during the experimental period. The bodyweight of the chickens was established pre- and post-infection. Symbols represent the mean of individual chickens. PBS control, M-LPAIV H5N1, C-LPAIV H7N1 and H7N7: n=6. C-LPAIV H5N2 and H9N2: n=5. **: P ≤ 0.01.
