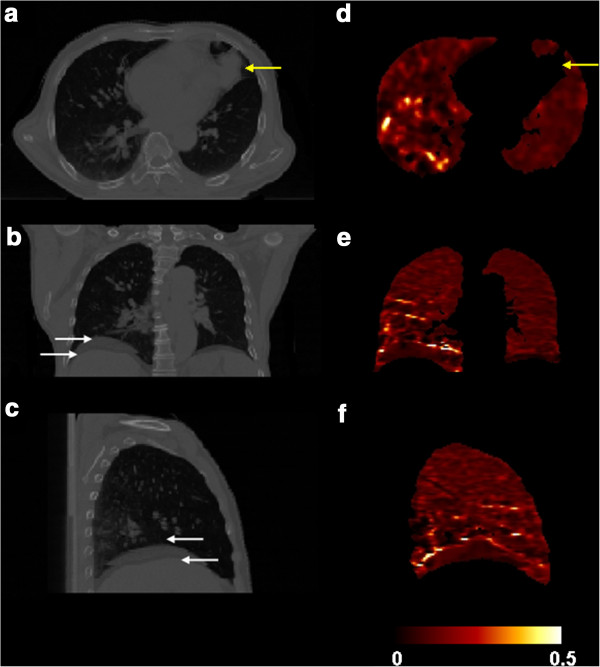
Figure 1.

The transverse (a), coronal (b) and sagittal (c) views of a 4D-CT. The arrow indicated the location of the tumor. Corresponding views of 50%-0% (expiration-inspiration) ventilation of this example are shown as in (d), (e) and (f). Low ventilation is noticeable in the tumor region (indicated by the arrow on the CT image) on the ventilation image. The arrows on the CT image set indicate that the right diaphragm motion range was large. This volume change difference can be observed on the ventilation image. The ventilation image is scaled as ΔV/V = 0 as black and 0.5 as white.
