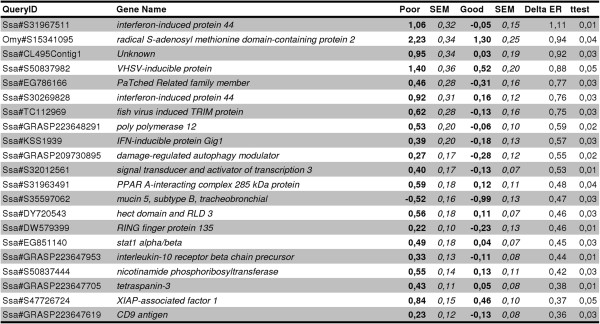
Figure 3.

Differentially expressed genes in poor versus good swimmers post IPN challenge. Microarray analyses resulted in 21 genes showing higher transcript abundance in cardiac muscle of poor swimmers compared to good swimmers. By function, all of these genes have been previously identified as virus responsive genes (VRGs). Data for Poor and Good swim performance groups is log2-ER (expression ratio) ± SEM (n = 9).
