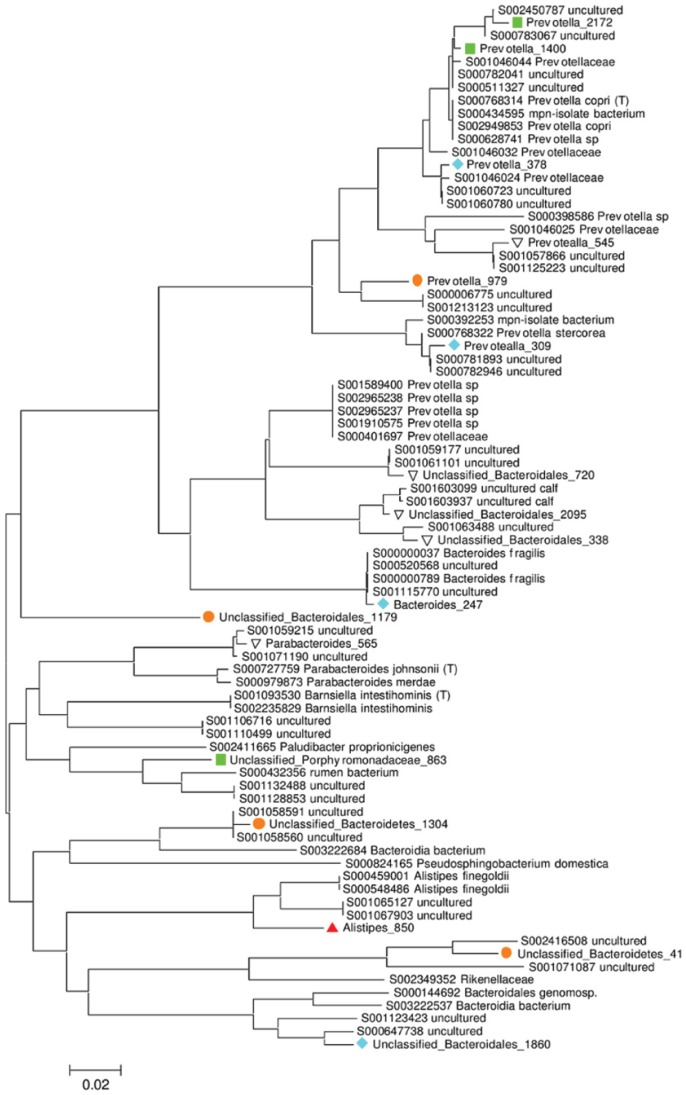
Figure 3. Figure.
3. Phylogenetic tree showing the most abundant OTUs within the Bacteroidetes phylum. Phylogeny is based on 400 bp alignment of the V4–V5 of the 16S rRNA gene, together with the closest matches from the Ribosomal Database Project. Together these 17 OTUs comprise 37.7% of the total sequences and 75.3% of those within the Bacteroidetes phylum. RDP sequences are labelled with their “S” accession number and taxonomic assignment. Coloured symbols indicate the distribution of OTUs (defined as 97% sequence similarity) that are shared between hosts; (green ▪) humans, cattle and chimpanzees, (blue ♦) humans and chimpanzees, (orange •) chimpanzees only, and (red ▴) cattle only. Each OTU name consists of its taxonomic assignment and a unique numerical identifier. Scale bars indicate the number of base substitutions per site.

