
Figure 3. Platelet accumulation as function of shear rate.
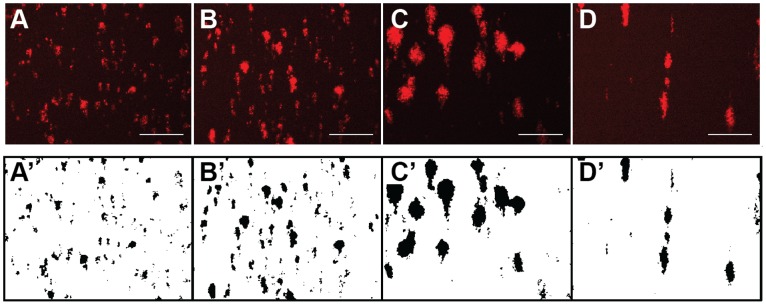
Platelets were labeled with a PE/Cy5 labeled mouse antihuman CD41a antibody and their accumulation was measured over the course of a 5 min flow assay. The top row shows the raw images and the bottom row shows the binary images following image processing at wall shear rates of 150 s−1 (A, A’), 300 s−1 (B, B’), 750 s−1 (C, C’) and 1500 s−1 (D, D’). Scale bar = 100 µm.