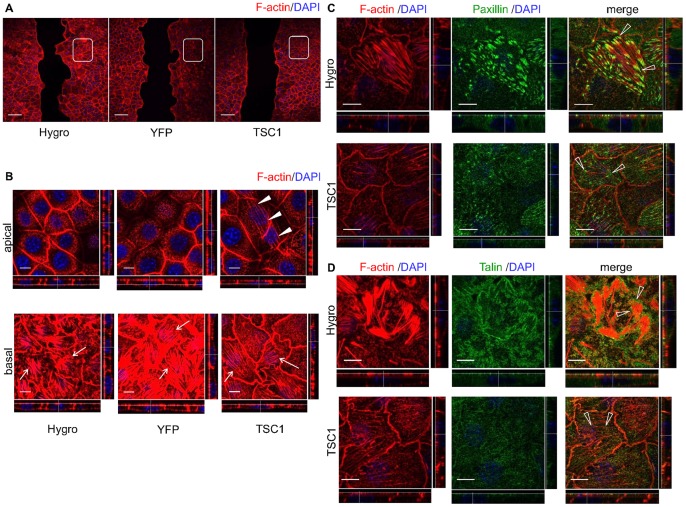
Figure 5. TSC1 reduces basal actin fibers and induces apical actin fibers in the confluent monolayer.
(A) Low-magnification confocal images of phalloidin stained cells. Boxed areas show the confluent monolayer. Scale bars: 100 µm. (B) TSC1 reduced basal actin fibers and induced apical actin fibers. Images show representative X–Y sections from scans at 0.5 µm steps from the basal (close to the substrate, lower panels) to the apical side (upper panels) of the cell. X–Z (top to bottom) and Y–Z projections (left to right) are shown at the bottom and right side of each panel, respectively. Dotted line indicates the level of X–Y images shown. Arrows denote actin stress fibers in the basal side of cells. Arrowheads indicate the actin fiber network in the apical side of CACL1-TSC1-11cells. Scale bars: 10 µm. (C, D) TSC1 inhibited formation of focal adhesions in the confluent stage. Cells in confluent monolayer were stained for F-actin and paxillin (C) or talin (D). Open arrowheads show focal adhesions connected to stress fibers. Scale bars: 10 µm.

