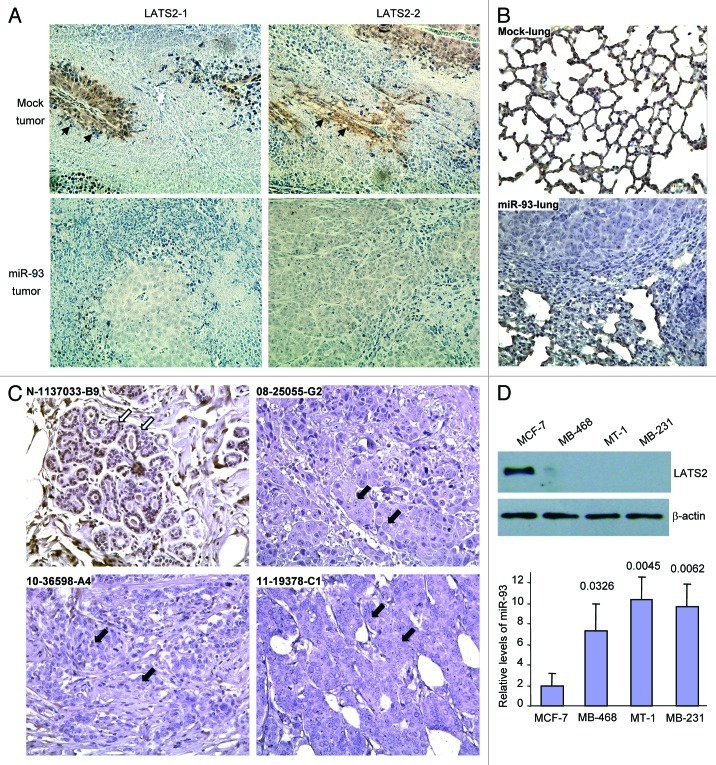
Figure 6. Repression of LATS2 expression in the miR-93 tumors. (A) Sections of tumor from mice injected subcutaneously with miR-93- or mock-MT-1 cells were probed with LATS2 primary goat antibody in 10% goat serum, followed by probing with anti-goat IgG. There were higher levels of LATS2 staining (arrows) in the mock tumor section compared with the miR-93 tumor sections. (B) To examine the metastatic tumors, sections from the lungs were probed with anti-LATS2 antibody. The levels of LATS2 were lower in the miR-93 group than in the control group. (C) Sections from human breast carcinoma and normal tissues (N) were subjected to immunohistochemistry for LATS2 expression. LATS2 was detected in the duct structure (open arrows) but not in the tumor mass (closed arrows). (D) Top: Cell lysates prepared from different human breast cancer cell lines were subjected to protein gel blot analysis probed with anti-LATS2 and anti-actin antibodies. LATS2 was detected in the benign breast cell line MCF-7. Right: the levels of miR-93 were analyzed by real-time PCR. The MCF-7 cells expressed significantly lower levels of miR-93 than the other breast cancer cell lines.

An official website of the United States government
Here's how you know
Official websites use .gov
A
.gov website belongs to an official
government organization in the United States.
Secure .gov websites use HTTPS
A lock (
) or https:// means you've safely
connected to the .gov website. Share sensitive
information only on official, secure websites.
