
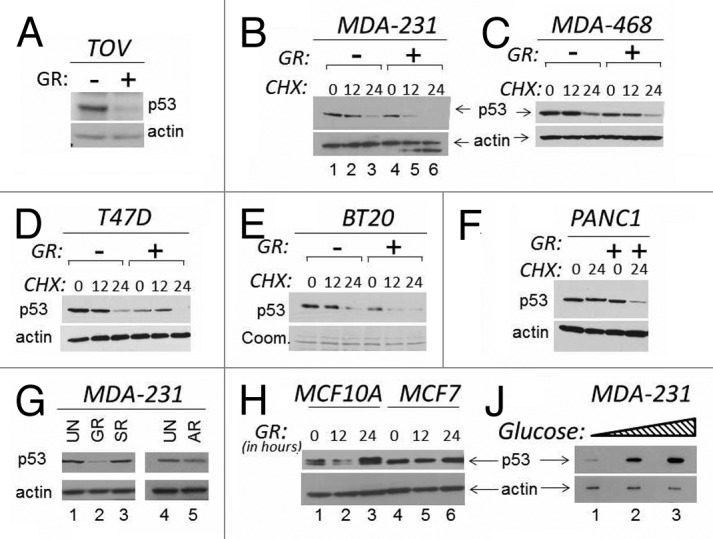
Figure 1. The levels of glucose affect mutant p53 expression. (A and B). TOV or MDA-231 cells were grown in regular media or in media lacking glucose (indicated as GR, - or +). In the experiment shown in (A), cells were harvested 16 h after GR, and cell extracts were subjected to immunoblot with anti-p53 or anti-actin antibodies. In (B), a time course in the presence of the translation inhibitor cycloheximide (CHX) is shown. Untreated (lanes 1–3) or GR-treated (lanes 4–6) cells were incubated with 40 μM CHX for the time indicated at the top of the panel (in hours). (C–F) The expression levels of p53 were assessed with experiments similar to those shown in (B) in the cell lines indicated at the top of each panel in the presence of GR and of CHX. All panels show p53 and actin levels. (E) shows Coomassie staining of the membrane (abbreviated Coom.). (G) MDA-231 were grown in regular media (25 mM, lanes 1 and 4); or in GR media (lane 2); or in media containing glucose (25 mM) but lacking serum (SR, lane 3); or lacking amino acids (AR, lane 5). (H) MCF10A (lanes 1–3) or MCF7 (lanes 4–6) cells were grown in regular media or in GR media for the time indicated at the top of the panel (in hours). (J) MDA-231 cells were incubated in 0 mM (lane 1), 5 mM (lane 2), 25 mM (lane 3) glucose for 12 h, followed by assessment of p53 and actin levels.