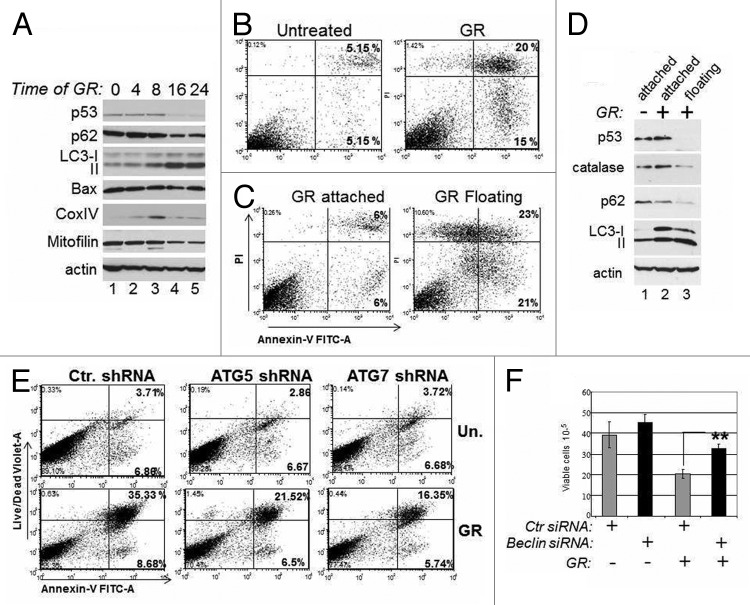
Figure 4. Mutant p53 depletion is accompanied by autophagic cell death. (A) MDA-231 cells were untreated (lane 1) or grown in GR media for the time points indicated at the top of the panel (in hours). At each point, cell extracts were prepared and probed in immunoblot with the indicated antibodies. (B and C). Flow cytometric analysis with Annexin-V vs. propidium iodide (PI) staining of live MDA-231 cells either untreated or glucose-restricted. Cells were analyzed as whole populations (B), or they were separated as attached and floating (C). The percentage of early (right lower panel) and late (right upper panel) apoptotic cells is indicated. (D) Untreated (lane 1) or GR-treated cells for 36 h (lanes 2 and 3) were separated as attached (lane 2) or floating (lane 3) cells. Cell extracts were probed with the indicated antibodies. (E) MDA-231 cells transfected with control shRNA or with the shRNA for ATG5 or ATG7 were selected with puromycin for 1 wk and then left untreated or GR-treated. Flow cytometry was performed as described in (B and C), except the live/dead violet staining was used in place of PI. (F) TOV cells were transfected with control siRNA (gray bars) or with the Beclin siRNA (black bars), as indicated at the bottom of the panel. Thirty-six hours after transfection, cells were subjected to glucose restriction for 8–12 h, then the media was replaced with regular media. Cell viability was assessed 4 d after with trypan blue exclusion. The p values between control and Beclin-siRNA-transfected cells in the GR-treated group are indicated.

An official website of the United States government
Here's how you know
Official websites use .gov
A
.gov website belongs to an official
government organization in the United States.
Secure .gov websites use HTTPS
A lock (
) or https:// means you've safely
connected to the .gov website. Share sensitive
information only on official, secure websites.
