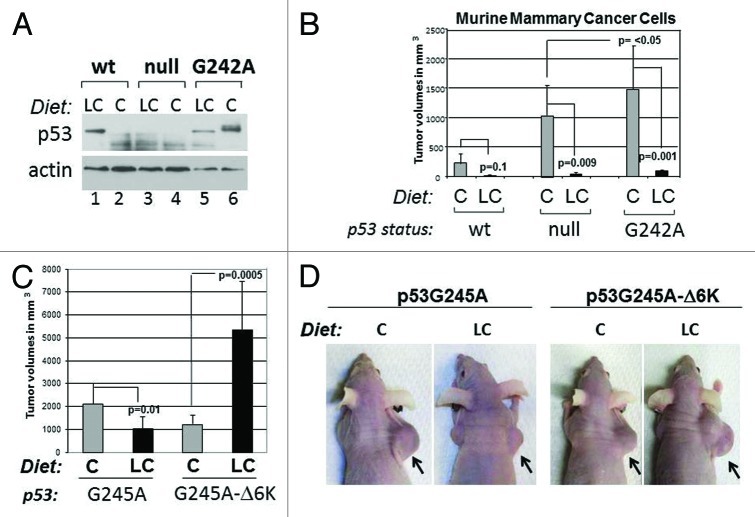
Figure 7. Effects of the carbohydrate-restricted diet on tumor development and relatively to p53 status. (A) Expression levels of p53 in wild-type, null or G242A murine syngenic cell lines relative to the dietetic regimen as indicated at the top of panels. Athymic nude female mice were injected subcutaneously in the flank. Prior to the injection, animals were randomized to receive the C or LC diet for 2 wk. Tumors were excised and analyzed for p53 or actin content. (B) Tumor volumes in these mice were assessed 3–4 wk after injection. The differences in p values for each group of animals are indicated by brackets. These experiments were performed twice and data were analyzed from 4–8 tumors, depending upon the genotype and conditions of treatment. (C and D) Tumor-forming capacity of H1299 cells expressing p53G245A or p53G245A-Δ6K, after implantation in nude mice and fed as described in (A). Mice received doxycycline once a week. In (C), tumor volumes derived from two independent experiments are shown as averages. Error bars represent standard deviations. The p values between different treatment groups are indicated by brackets. Mice derived from one set of experiments are shown in (D).

An official website of the United States government
Here's how you know
Official websites use .gov
A
.gov website belongs to an official
government organization in the United States.
Secure .gov websites use HTTPS
A lock (
) or https:// means you've safely
connected to the .gov website. Share sensitive
information only on official, secure websites.
