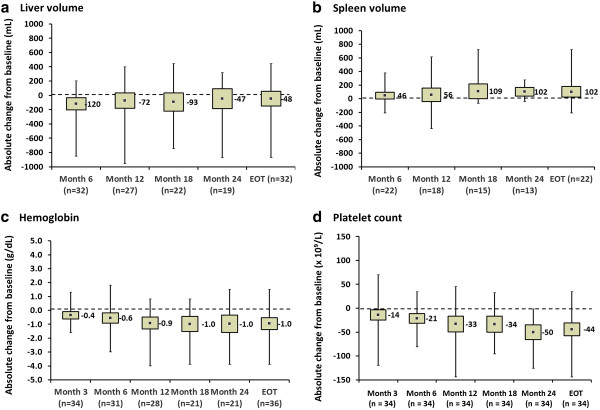
Figure 2.

Absolute changes in primary and secondary efficacy parameters during 24 months of miglustat therapy (full analysis population). Changes from baseline in a) liver volume, b) spleen volume, c) hemoglobin concentration and d) platelet count. Data are mean absolute change from baseline (square points), with 95% confidence intervals (grey boxes) and minimum–maximum value ranges (solid vertical lines).
