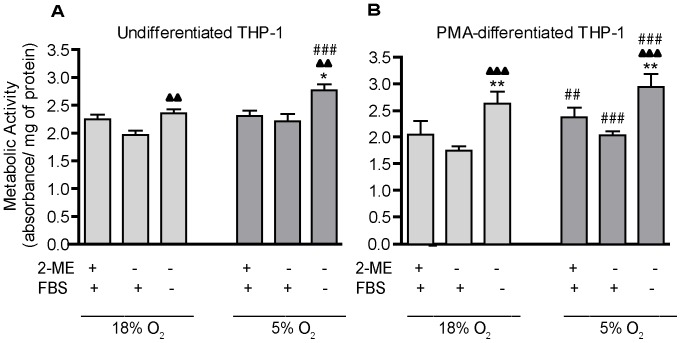
Figure 2. Influence of O2 tension, 2-ME and serum on the metabolic activity of THP-1 cells.
THP-1 cells were synchronized by serum deprivation for 48 h. (A) Undifferentiated THP-1 cells were plated in 96-well plates precoated with poly-D-lysine. (B) THP-1 cells were triggered to undergo macrophage differentiation by incubating with PMA at 20 ng/ml for 24 h. MTT was added to both undifferentiated and differentiated THP-1 cells for 3 h under varying O2, 2-ME and serum conditions. MTT reduction, measured as the absorbance at 562 nm, was normalized to protein concentration. Data are presented as the mean ± SEM (n = 4 independent experiments. *Significantly different from +2-ME+FBS (standard culture conditions) under the same oxygen tension (one-way ANOVA and post hoc Tukey’s test); ▴Significantly different from –2-ME+FBS under the same oxygen tension (one-way ANOVA and post hoc Tukey’s test); #Significantly different from the same culture condition in the 18% O2 group (e.g., 18% O2 versus 5% O2) by Student’s t-test. *, #, ▴ p<0.05; **,##, ▴▴ p<0.01; ***, ###, ▴▴▴ p<0.001.

