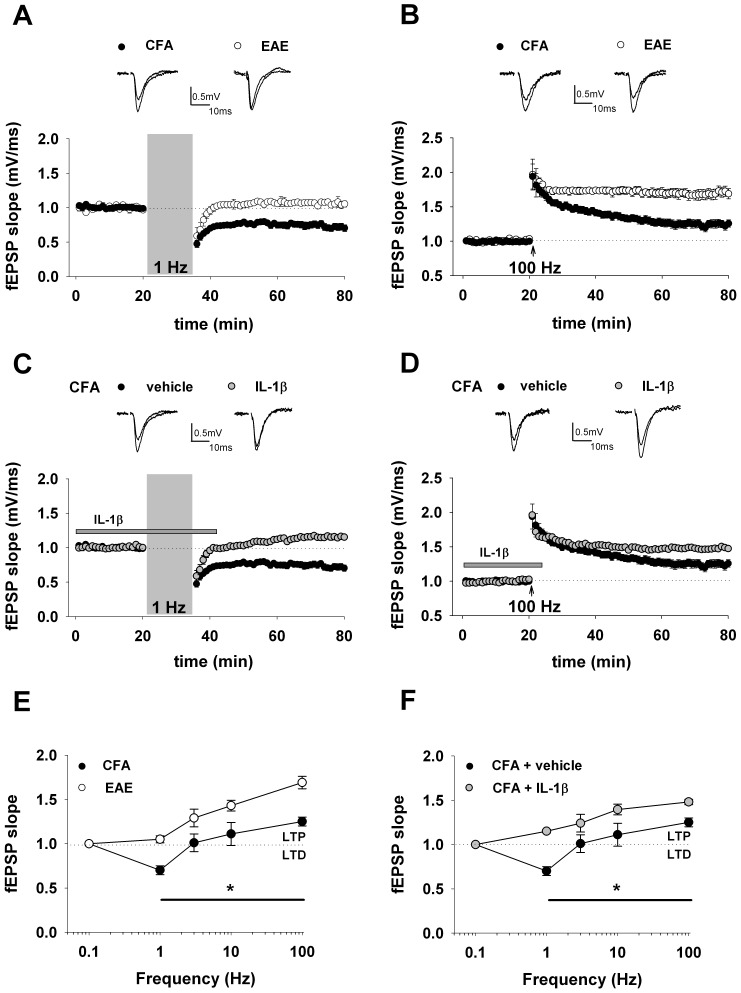
Figure 1. Shifted frequency-response curve in the hippocampus of EAE mice and in response to IL-1β.
A) Sample traces (above) and summary graph (below) of the averaged time course of LTD (CFA, n = 11; EAE, n = 12) induced by paired-pulse low-frequency stimulation protocol (PP-LFS: 1 Hz, 15 min). Here and after, insets show field EPSPs from representative experiments during a baseline interval and 60 min after delivery of conditioning train. B) Sample traces (above) and summary graph (below) of the averaged time course of LTP (CFA, n = 9; EAE, n = 12) induced by high-frequency stimulation (HFS: 100 Hz; 1 s). C) Sample traces (above) and summary graph (below) of the averaged time course of LTD induced by PP-LFS in CFA animals with (n = 10) or without (n = 11) IL-1β application (30 ng/ml). Bar indicates the exposure time to IL-1β. D) Sample traces (above) and summary graph (below) of the averaged time course of LTP induced by HFS in CFA animals with (n = 9) or without (n = 9) IL-1β application. E) Frequency-response function in EAE and CFA mice. The graph shows the percentage change in synaptic strength from baseline in EAE and CFA animals at 60 min following stimulation at the indicated frequencies (at least 7 slices were tested for each condition). 0.1 Hz was used to monitor synaptic transmission throughout the experiments. Values are mean ± S.E.M. * indicates p<0.05 (t-test) at all frequency tested. F) Shown is a frequency–response graph of the fEPSP changes induced by four different stimulus frequencies in CFA animals with or without IL-1β.

