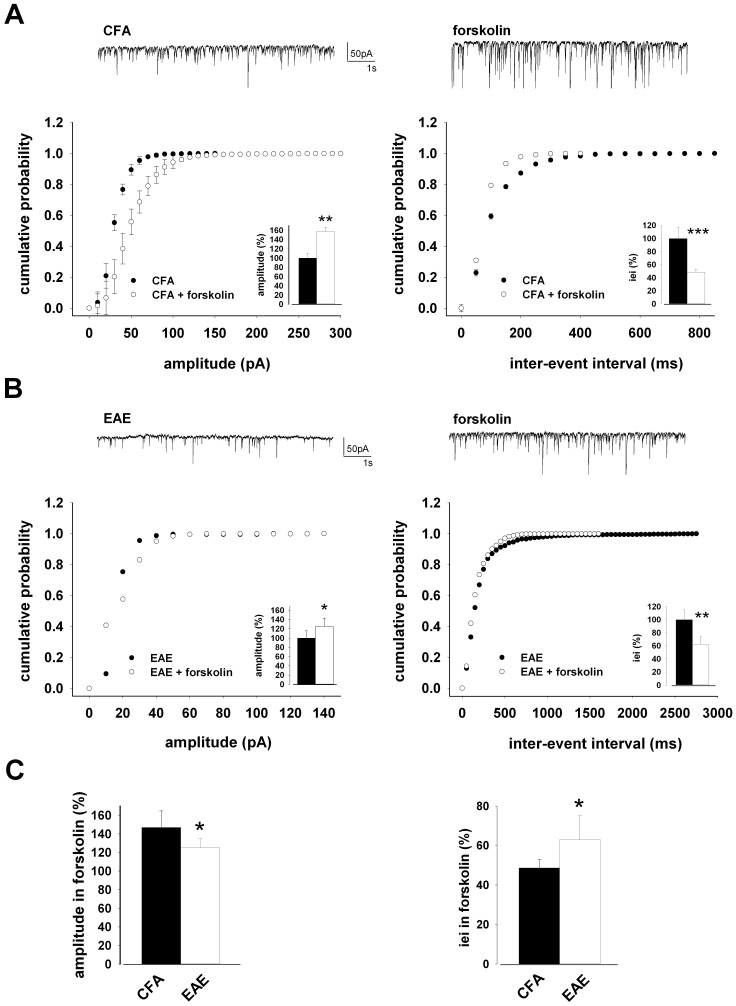
Figure 4. GABAergic transmission is lower in EAE mice in the presence of forskolin.
A) Pooled (mean ± S.E.M) cumulative distributions of sIPSCs amplitude (left; bin size 10 pA) and inter-event interval (right; bin size 50 ms) recorded from neurons of CFA in the absence and presence of forskolin (30 µM). Histograms in the insets are averages (mean ± S.E.M) of the corresponding median values for neurons of CFA, in control conditions and following forskolin perfusion. On top are representative trace records from CFA (left) or CFA in the presence of forskolin (right). B) Cumulative distributions of sIPSCs amplitude (left) and inter-event interval (right) recorded from EAE slices in control conditions and in response to forskolin. The traces on top are obtained from same neuron, in control conditions and during forskolin application. Histograms in the insets are averages (mean ± S.E.M) of the corresponding median values. C) Histograms (mean ± S.E.M) of the maximal effect on sIPSC amplitude (left) and inter-event interval (right) reached in the presence of forskolin both in CFA (n = 10) and EAE (n = 14) mice.

